Introduction
The Pipeline Analytics page provides various metrics and views to assess the pipeline and its historical and projected performance.. This helps in making business decisions more effectively. The filters section at the top of the page helps you view the charts based on various data dimensions and for various time horizons.
Customise
The ‘Customise’ option found at the top-right of the page (gear icon) can be used to see/hide the charts that you are interested in.
.png)
Sections and Charts
Booking Trends by Quarter of Close
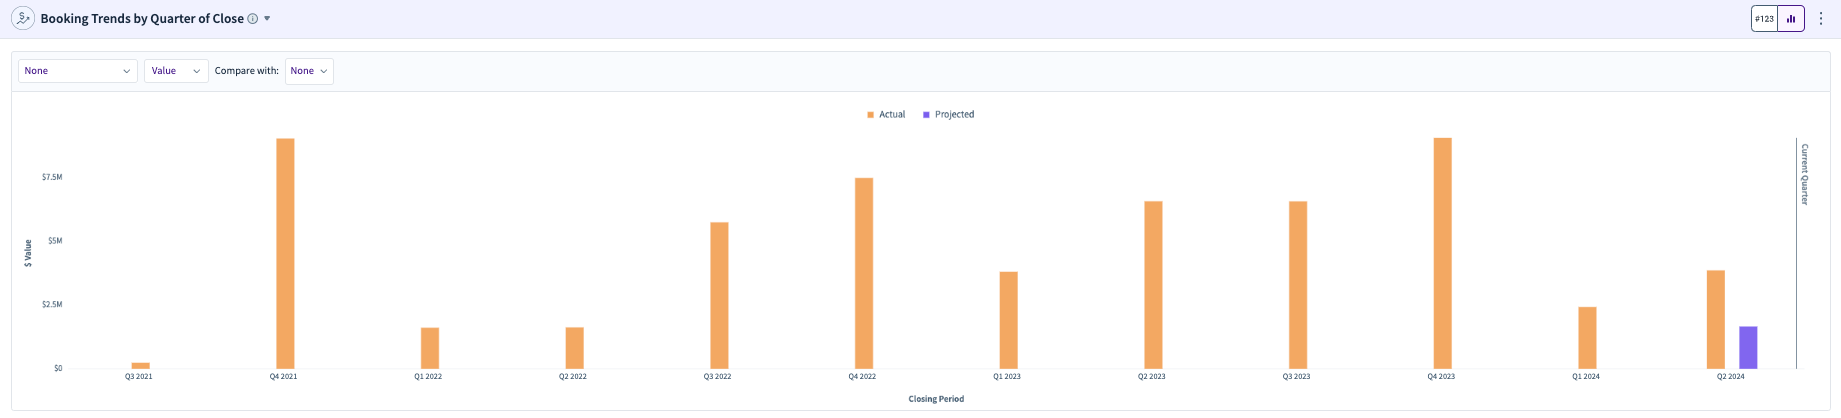
The Booking trends chart shows the bookings for each quarter, closing each quarter.
For the past quarters, it shows the past/actual booking values. For the current and future quarters, it shows projected values. For the current quarter, you can also see the current booking and projected bookings on two different bars, one as Quarter till date and the other as Current Quarter with the 'Projected’ tag.
Walk-in Pipeline by Quarter of Close
The walk-in Pipeline represents the Day 0 Pipeline at the start of the quarter, closing that quarter, or at the start of the month, closing the quarter of that month.
For past and current quarters, the walk-in Pipeline represents the actual Day 0 pipeline at the start of the corresponding quarter, and for future quarters, it represents the projected Day 0 pipeline at the start of the quarter
Win Rate Trends by Quarter of Close
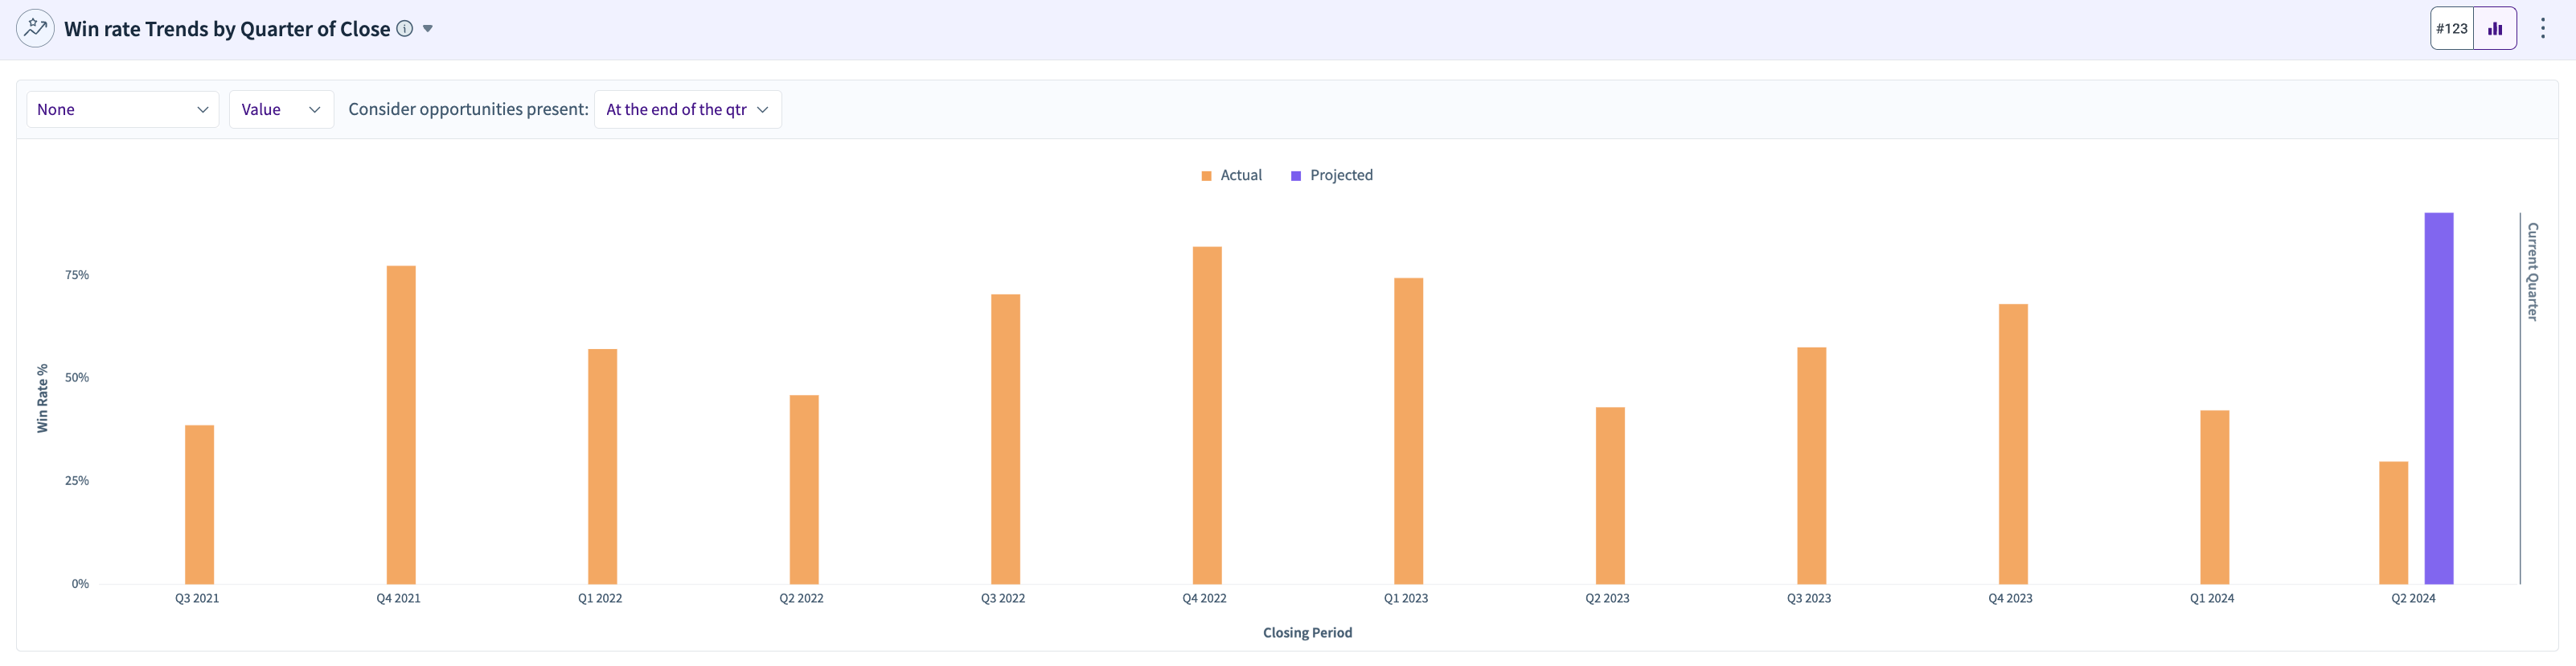
This chart shows the win rate as a percentage of the total number of opportunities per quarter. For the current quarter, it shows the win rate of QTD and the projected win rate for the rest of the quarter.
You can choose which opportunities should be considered in the win rate calculation
At least x days in the quarter - For example, 60 days. Only include opportunities that were open for at least 60 days within that specific quarter.
Suppose Q2 spans May–July. An opportunity opened on July 20, and the filter is “at least 60 days”:
Calculated as (total closed won opps at the end of the quarter) / (total opps that were open at least 60 days)
That opp has only been open for 11 days in Q2 → it is excluded from Q2 win rate calculation.
At the end of the quarter, only include opportunities that were still open (active) at the end of the quarter.
Calculated as (total closed won opps at the end of the quarter) / (total opps open at the end of the quarter)
This includes the opportunity that was opened on July 20, if it is still open at the end of the quarter.
Pipeline Snapshot
Pipeline Snapshot refers to the pipeline for the chosen closing quarter at the end of each quarter.
For example, if the closing quarter is chosen as Q4 2023, and if the current quarter is Q4 2023, the pipeline snapshot at the end of each past quarter and the pipeline till QTD will be shown along with the projected pipeline for the end of the current quarter.
Similarly, if the closing quarter is chosen as Q2 2024, and if the current quarter is Q4 2023, the pipeline snapshot at the end of each past quarter and the pipeline till QTD will be shown along with the projected pipeline at the end of Q4 2023, Q1 2024, and Q2 2024.
.png)
Pipeline Movements
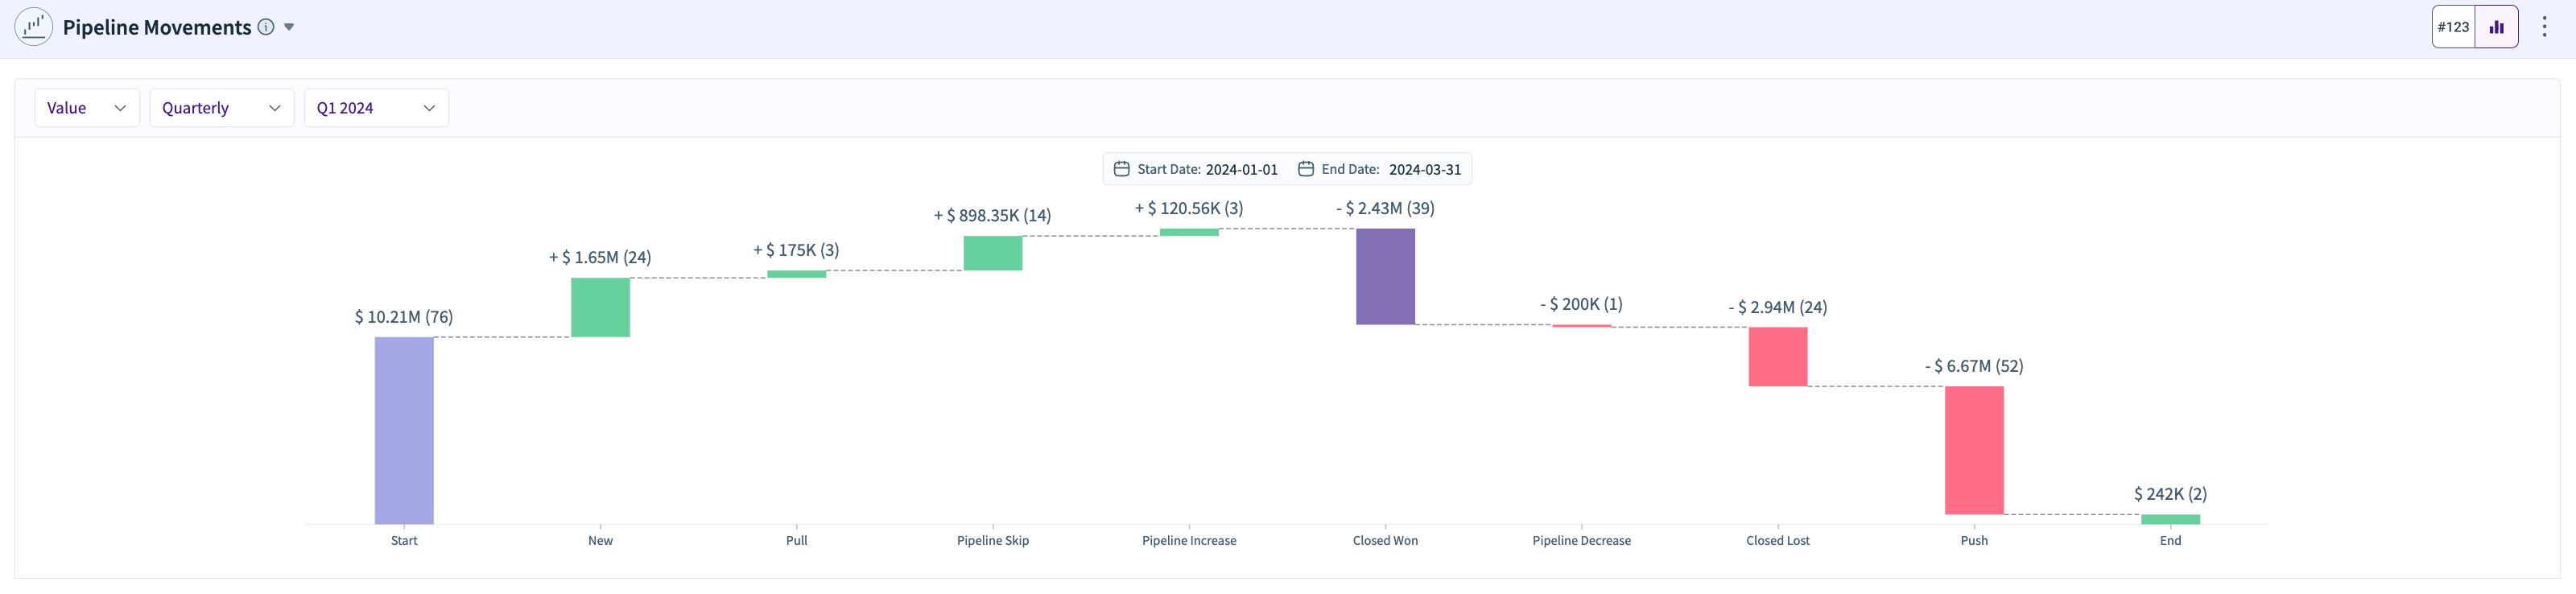
Pipeline Movements shows all movements from the start of the quarter to the end of the quarter for a selected closing quarter of choice. The quarter of choice should be selected by the period filter at the top. The chart can be viewed in terms of ‘Value’ or in terms of ‘Volume’.
For the past quarters, this chart shows how the pipeline moved from the start to the end of that quarter. For the current and future quarters, it shows how the pipeline has moved from the start to the end of the current quarter.
The various stages shown in the chart are: Start, New, Pull, Pipeline Skip (opportunities that skipped the pipeline stage and ended up either closed lost or closed won), Pipeline Increase, Closed Won, Pipeline Decrease, Closed Lost, Push, and Current/End (‘Current’ for the current and future quarters selection, ‘End’ for past quarters).
Start - Pipeline that you walked into the quarter with, with a close date in the quarter. Also known as Walk-in Pipeline
New - Pipeline that is created in a quarter with a closing date in the same quarter
Pull - Pipeline that is pulled into the quarter from other quarters based on their closing date.
Pipeline Skip - Opportunities that skipped the pipeline stage and went directly into either the booking or leakage stages
Pipeline Increase - Opportunities whose values increased during the quarter
Pipeline Decreased - Opportunities whose values decreased during the quarter
Closed Won - Opportunities that progressed to the Booking stage during the quarter
Closed Lost - Opportunities that progressed to the leakage stage during the quarter
Push - Opportunities that got pushed out of the quarter to another quarter based on their closing date
Current - Opportunities that are currently open with a closing date in that quarter as of the current date.
Note: This widget will consist of any movement that happened within the quarter only. Any closed lost/closed won after the end of the quarter will not be tracked. Hence, the numbers might not match between the closed won widget and the closed won in this widget.
Pipeline Generation Trend
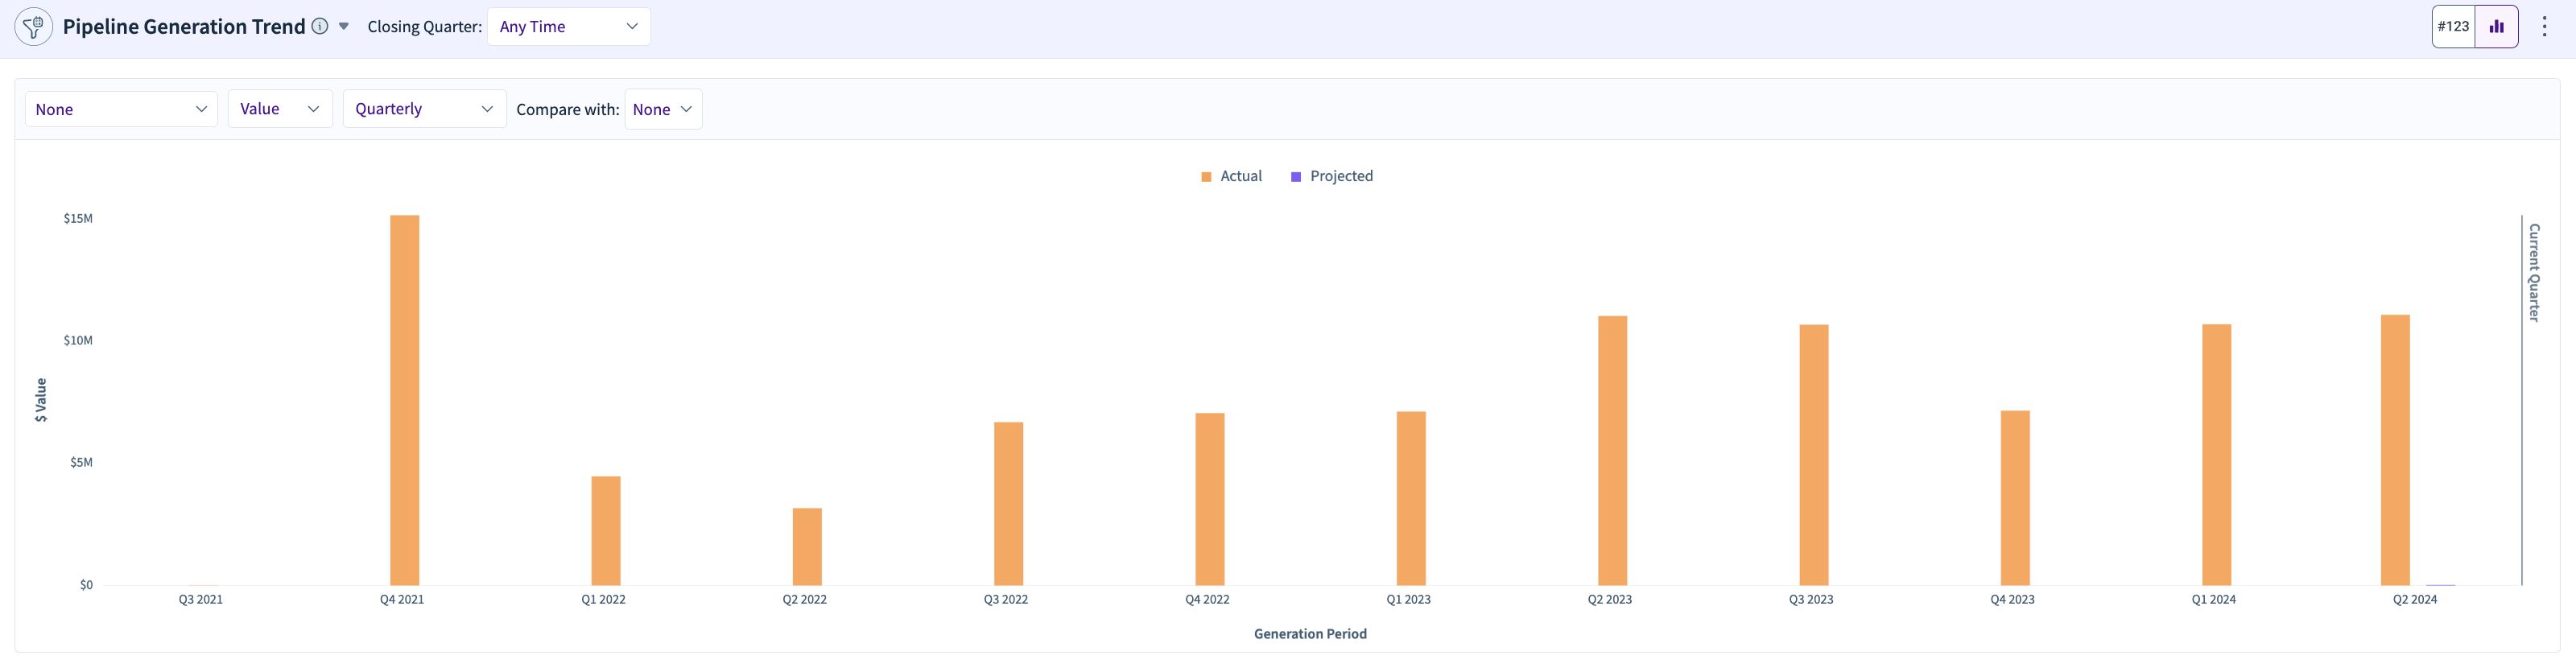
This chart refers to the Pipeline generation in each quarter for the chosen closing quarter.
For example, if the closing quarter is chosen as ‘All Time’, show the pipeline generation in each quarter closing for all time for the past quarters and the current quarter till date, along with the projected values of the current and future quarters.
Projected Pipeline By Projected Closing Quarter
This shows the pipeline projected to be generated in each quarter, along with the information about when it will close.
You can choose which quarter the pipeline should have been/will be generated in, and the x-axis of the chart or the columns in the table will show you when they will close.
Projection Tracking
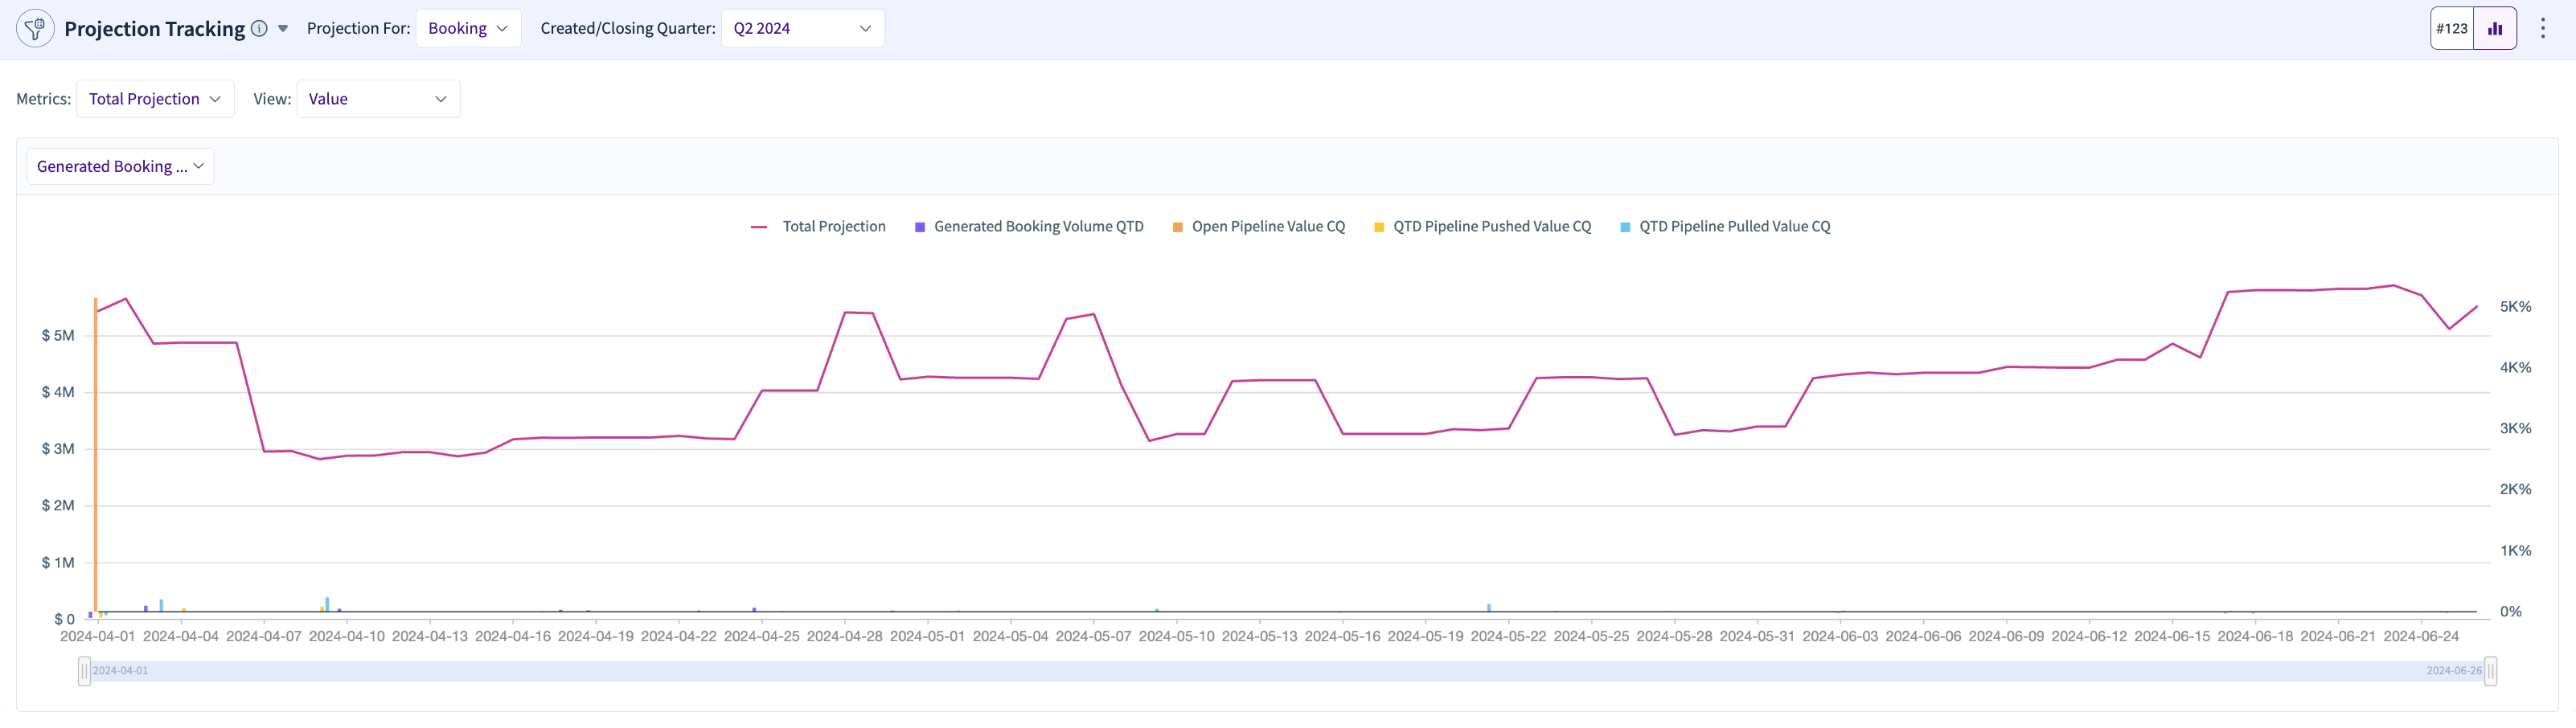
The Projections Tracking chart consists of the projections tracking side panel from Pipeline and Booking generation in Pipeline Projections.
The widget shows the projections on each day of the quarter (starting from Day 1 to date). For past quarters, it shows the projections for the days of that quarter. For current and future quarters, it shows the projections for the days of the current quarter.
Along with this, the chart also shows the macro model features and their associated changes. The table view should show metrics such as Total Projections, Demand Gen. Potential, Current Pipeline/Booking, and Projections from Funnel.
Pipeline Stage to Stage Progression
This chart refers to the progression of the pipeline from one stage to the next during the selected progression year and is marked with the selected closed date. The stage should have been created in the selected creation period, and the progression should have happened in the selected progression period.
For example, suppose the period is chosen as ‘This Year’. In that case, the progression period is also chosen as ‘This Year’, with a close date in ‘Q4 2023’, show all opportunities wthat were created in this year in that stage, with a close date of Q4 2023 and progressed in this year from Stage 1 to Stage 2, and from Stage 2 to Stage 3, and from Stage 3 to Stage 4, and so on.
.png)
Progression to Specific Stages
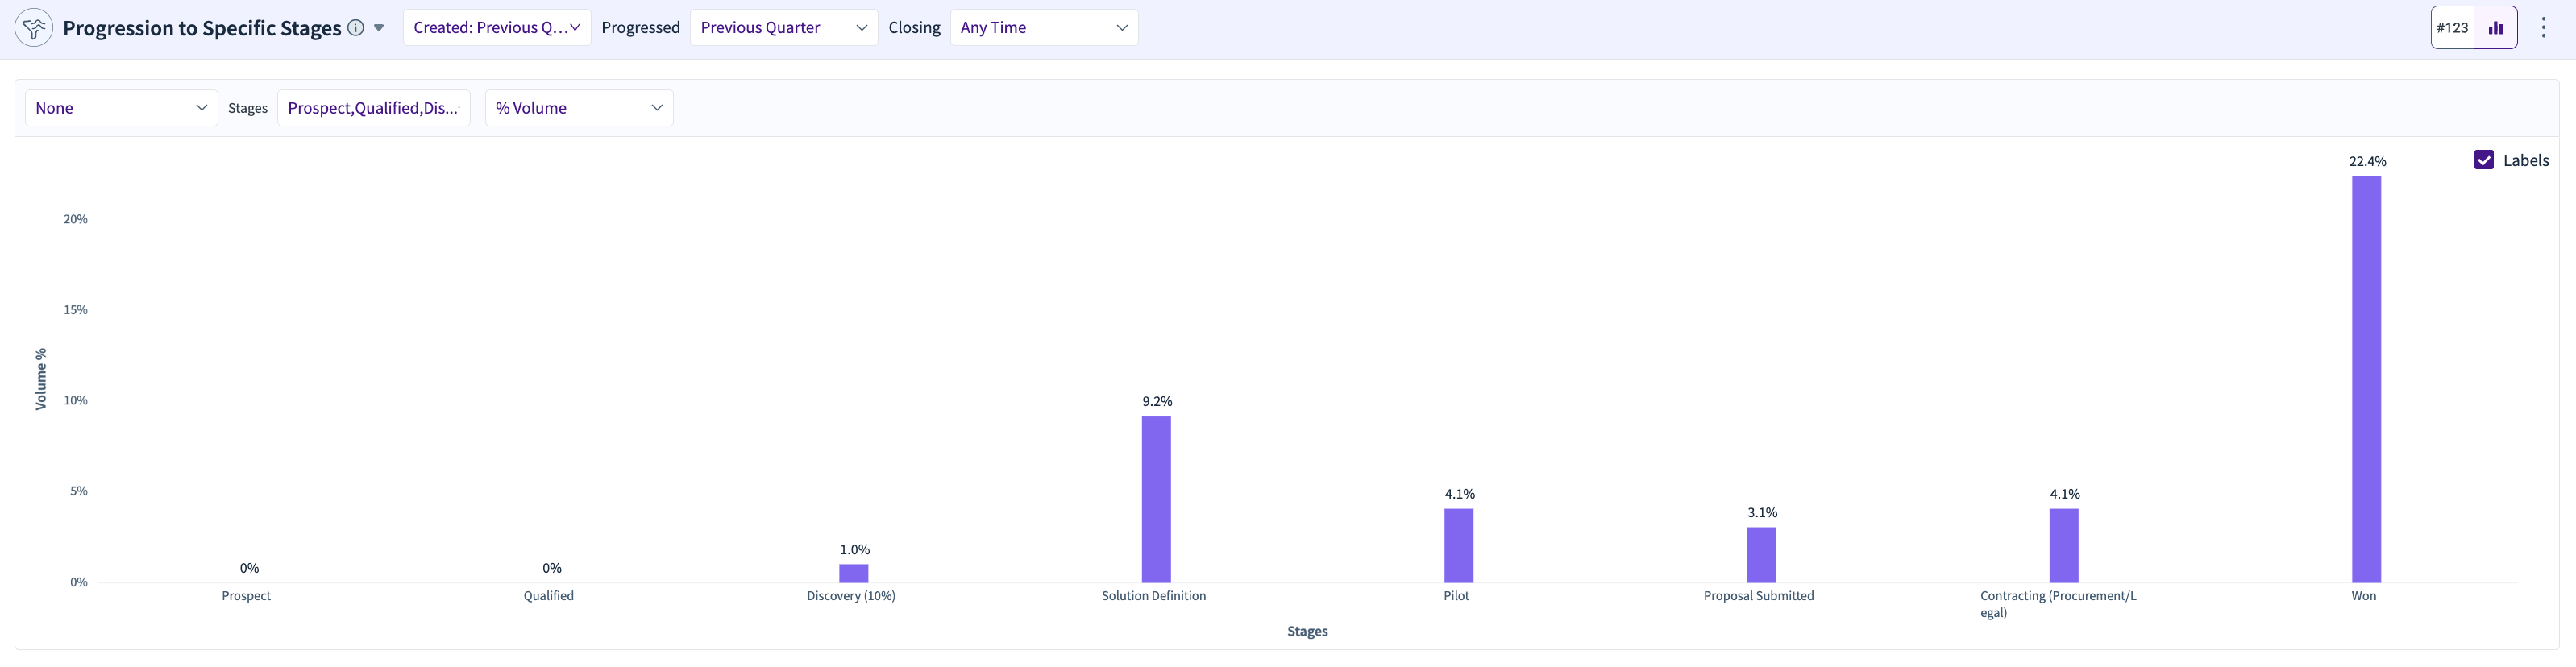
This chart refers to the progression of the pipeline into specific stages selected in the filter selection, but progressed during the selected year and marked with the selected closed date. This looks at all the opportunities that were created or opened in the pipeline in the selected period and progressed to each of the pipeline stages in the progressed period.
For example, if the period is chosen as ‘This Year’, progression period is also chosen as ‘This Year’, with close date in ‘Q4 2023’, show all opportunities that were created in this year, with a close date of Q4 2023 and progressed in this year from any stage to stage 1, stage 2, stage 3, etc.
Pipeline Progression Trends
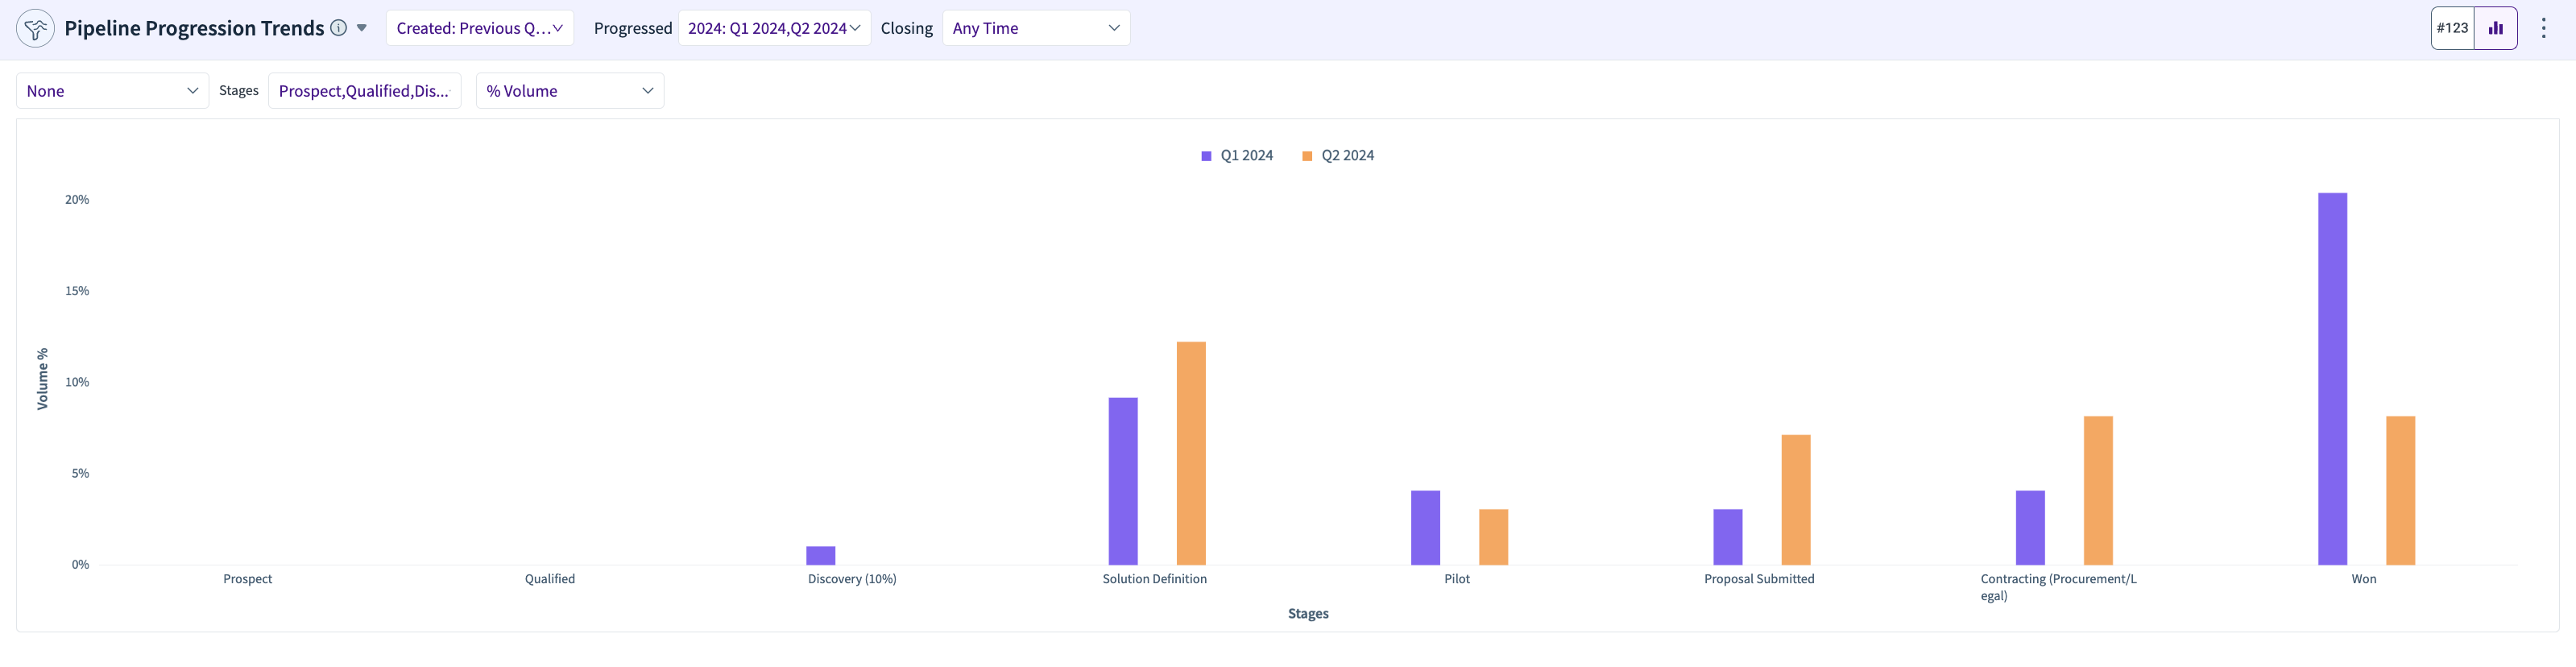
This is very similar to ‘Progression to Specific Stages’. The progression period options here are limited to a maximum of 4 quarters in the 'Progressed’ selection. The displayed quarters should be from the start of the created period to till date.
For example, if the selected period is 01-Jan-22 to 31-Dec-24, and current date is Q1 2024, then the options shown are (2022-> Q1,Q2,Q3,Q4), (2023 → Q1,Q2,Q3,Q4) and (2024 → Q1). Among these, the user can select up to a maximum of 4 quarters.
Pipeline Development Trends
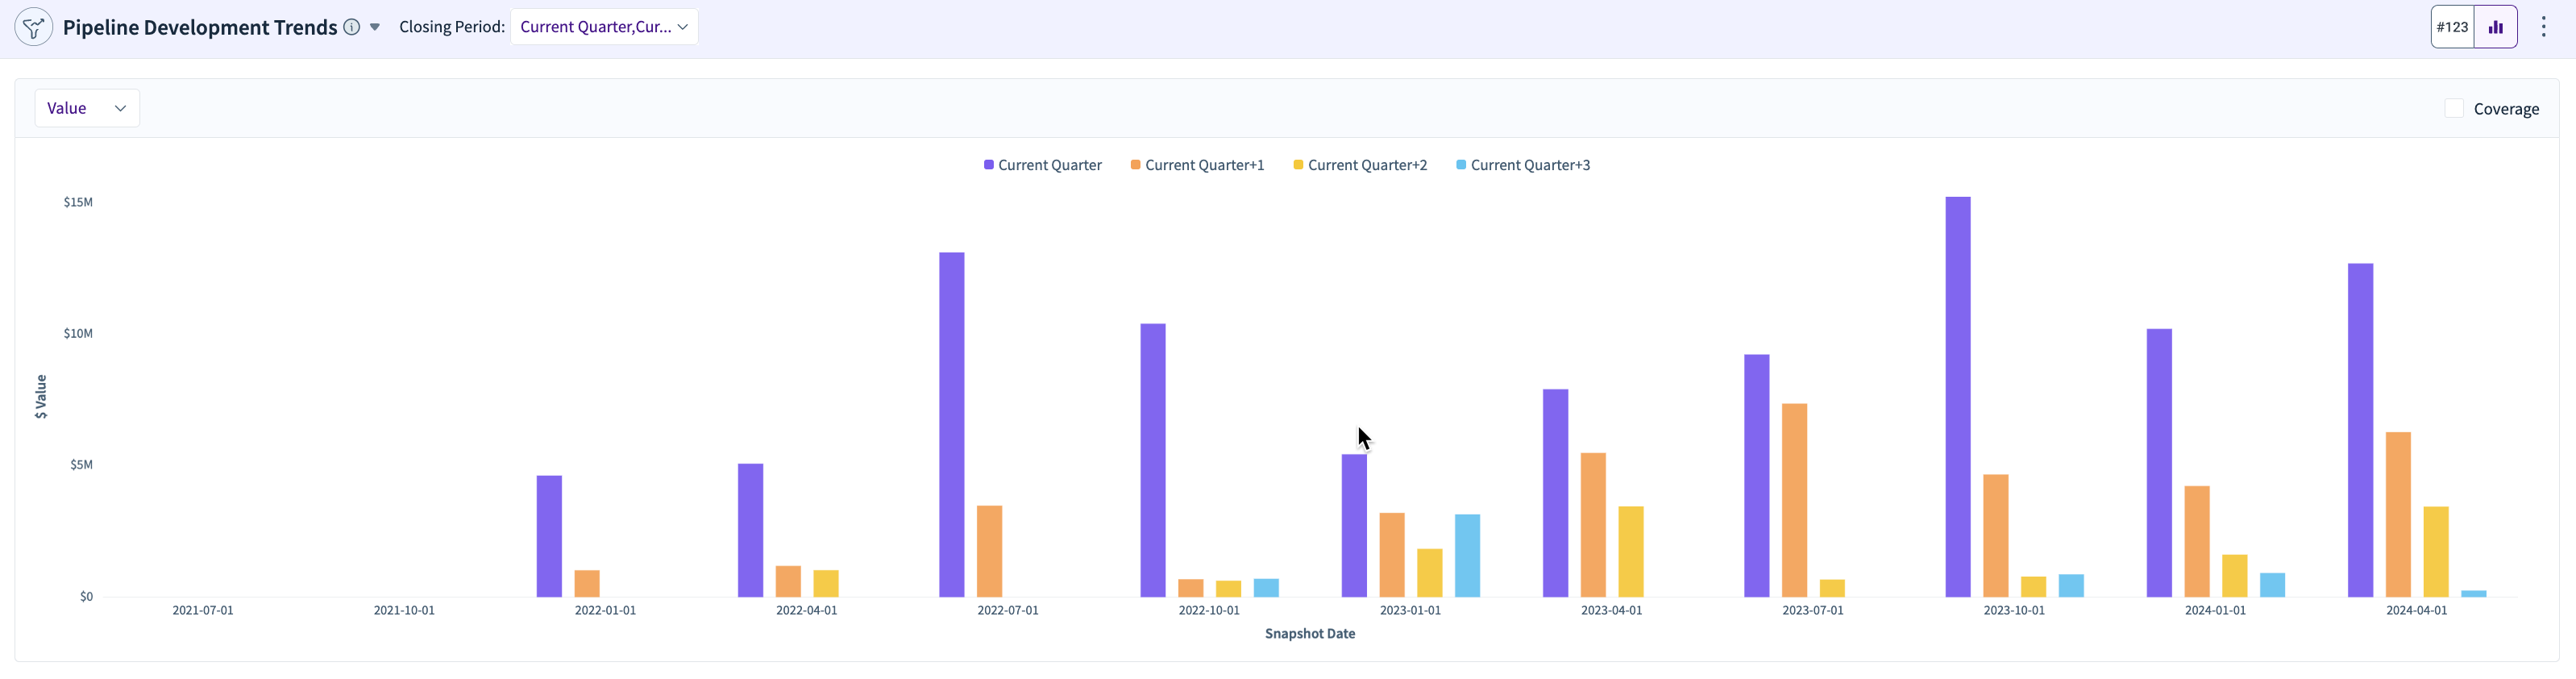
This chart shows the open pipeline snapshots at the start of each quarter and its quarter+1, quarter+2, and quarter+3 values as seen from that quarter.
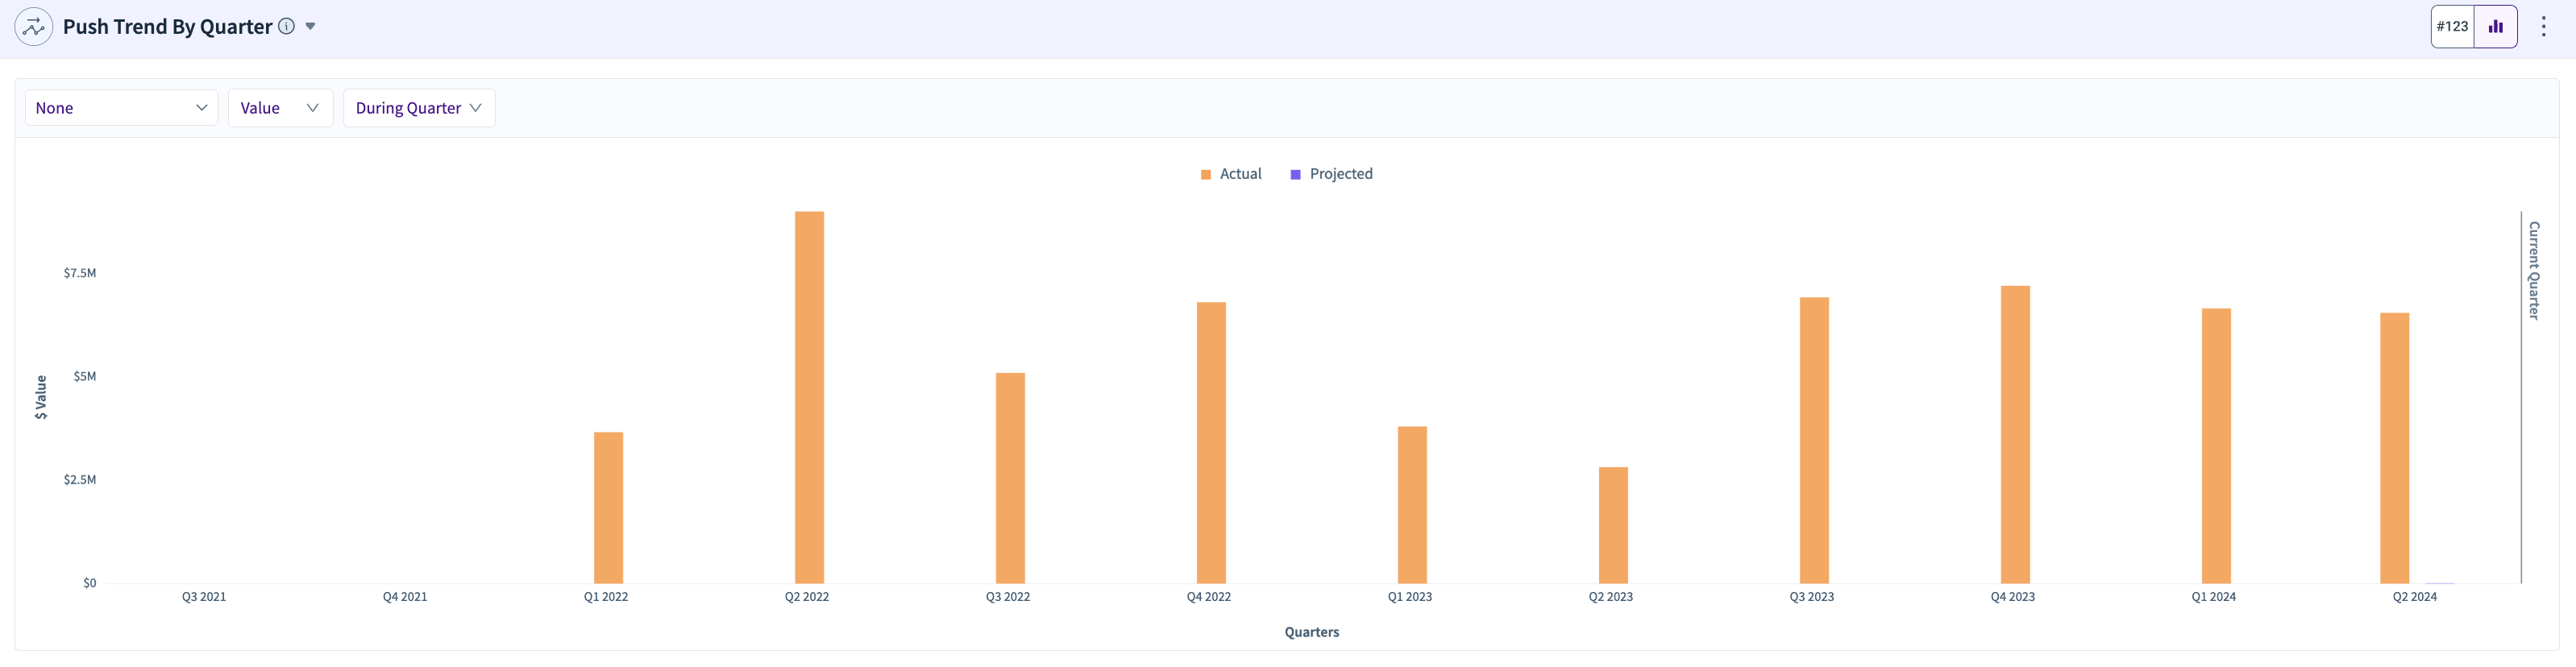
Push Trend By Quarter
This chart shows the trend of ‘push’ that has happened in each quarter from the closing period of that quarter to any target quarter. There is no limit on the created period.
You can split by Target Quarters (the quarter it was pushed to) or by any other dimension. You can also filter the date and view the chart for a particular target quarter.
Additionally, you also have 3 options to see when the push happened - Before quarter, During Quarter, or All time.
Pull Trend By Quarter
This chart shows the trend of ‘pull’ that has happened in each quarter from the closing period of any quarter to that quarter. There is no limit on the created period.
You can split by Source Quarters (the quarter it was pulled from) or by any other dimension. You can also filter the date and view the chart for a particular source quarter. Additionally, you also have 3 options to see when the pull happened - Before quarter, During Quarter, or All time.
.png)
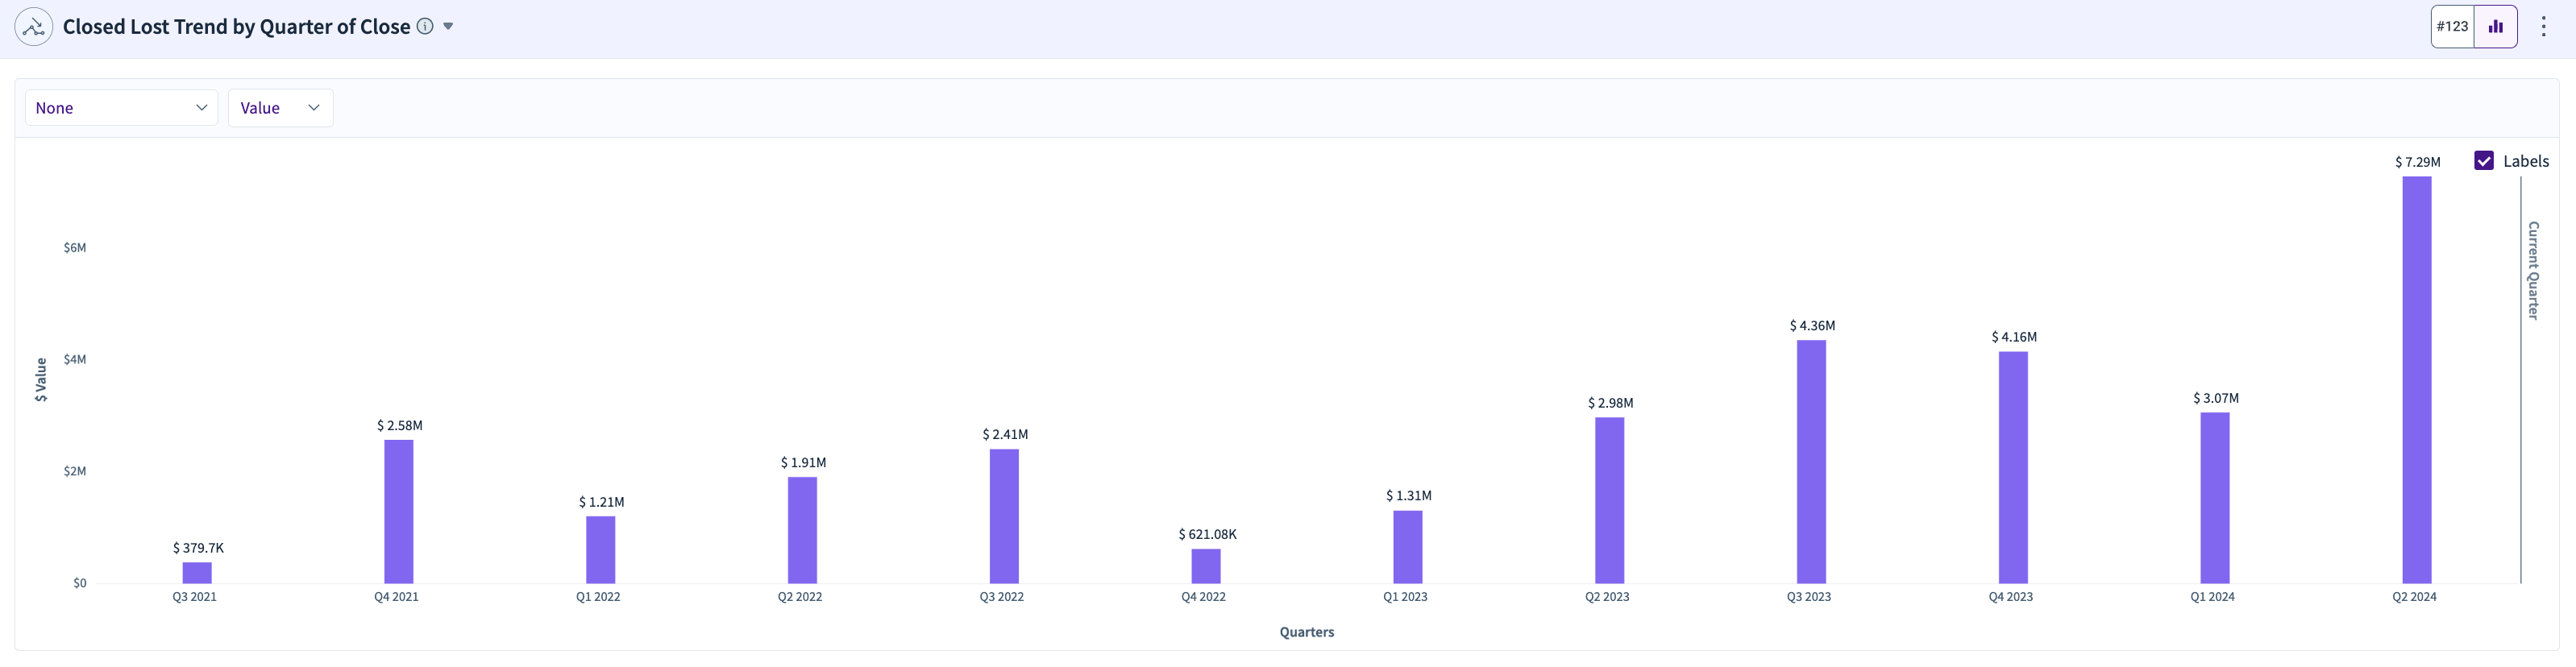
Closed Lost Trend by Quarter of Close
The ‘Closed Lost Trends’ chart shows closed lost leads for each quarter closing that quarter, or each month closing that month, for the selected period.
For example, if ‘Period’ is 01-01-2023 to 01-06-2024, and the current date is Q1 2024, show the bookings in Q1 2023, Q2 2023, ..., Q4 2023, Q1 2024. This chart doesn’t show any future months/quarters.
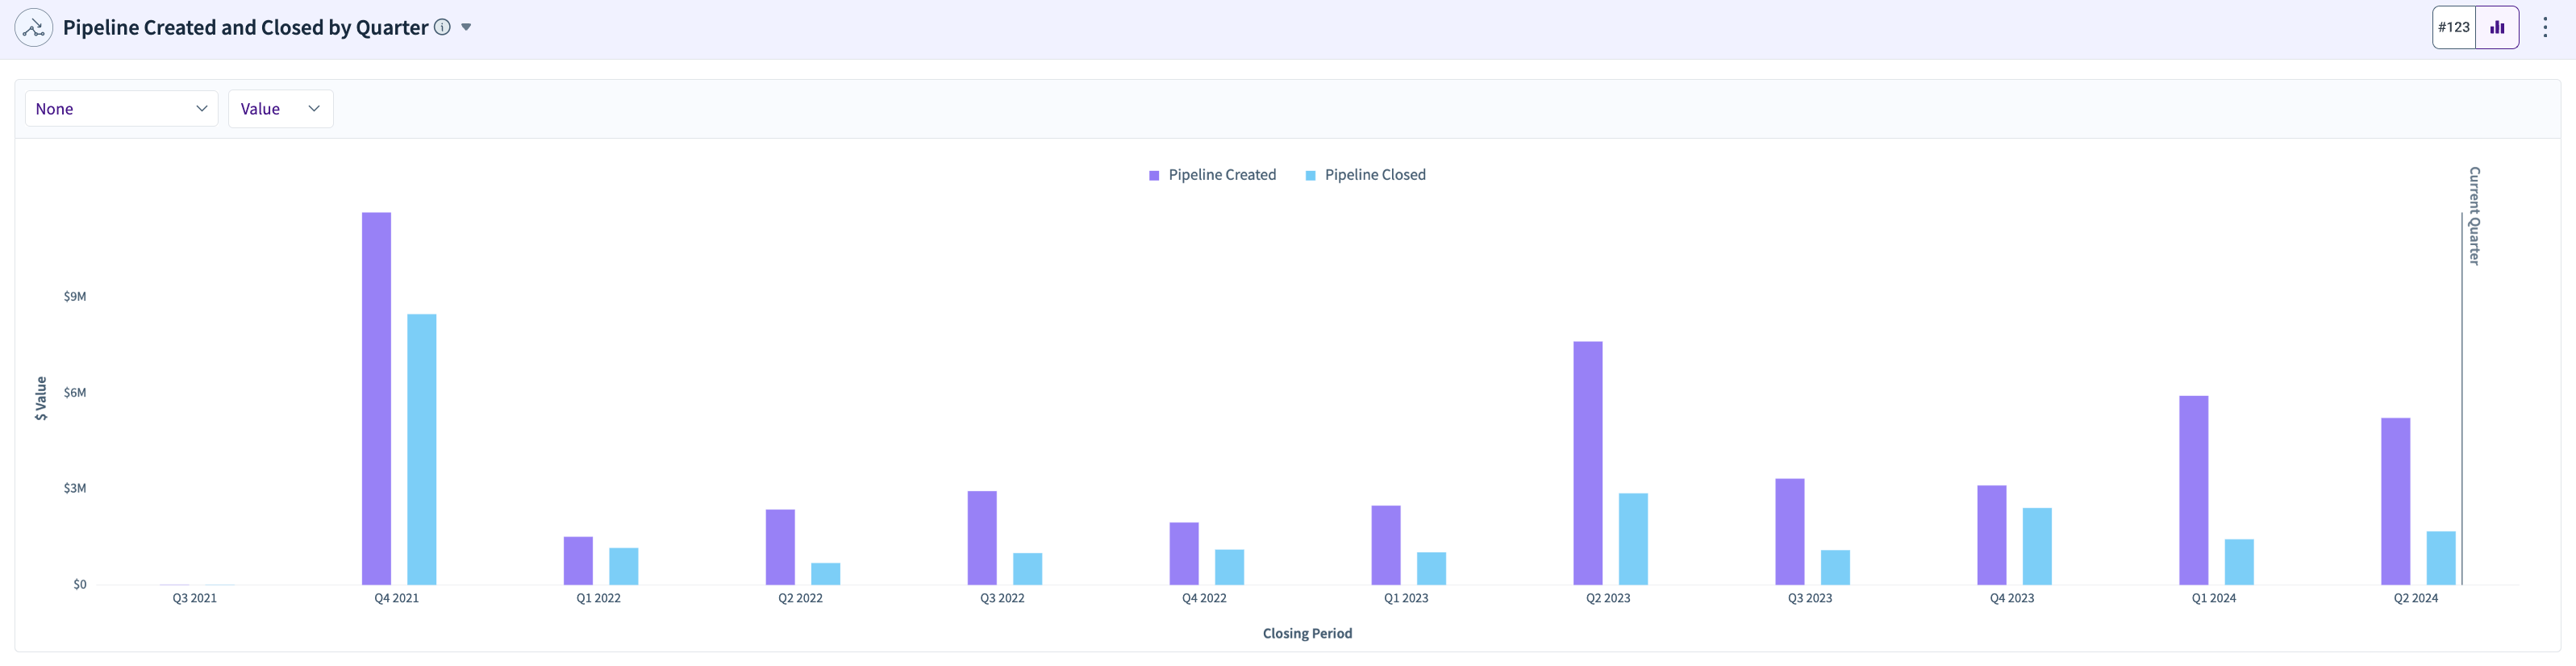
Pipeline Created and Closed by Quarter
This column chart shows the pipeline that was created during a quarter, and from that, how much was closed during the same quarter.
For example, if the Pipeline was created for Q1 2024 is 89 (‘Volume’ view). Out of those 89, if 31 converted to closed won, then the chart will show these two columns for Q1 2024. The same can also be viewed in terms of ‘Value’, ‘% Value’, and ‘% Volume’. The percentage value and volume options show the Pipeline Created and Closed as a percentage of the Bookings for that quarter.
Pipeline Created % = (Pipeline Created in a quarter for the quarter / Total Pipeline created for the quarter in all quarters) * 100%
Pipeline Closed % = (Pipeline Closed from the pipe created in the quarter / Total Pipeline created for the quarter in all quarters) * 100%
Walk-in Pipeline Win Rate by Quarter
This column chart shows the walk-in pipeline converted to booking as a percentage of the walk-in pipeline.
It is a cohort of the bookings from the walk-in pipeline as a percentage.
For example, if $20M is the booking revenue from a walk-in pipeline of $100M, then the walk-in pipeline win rate is 20%.
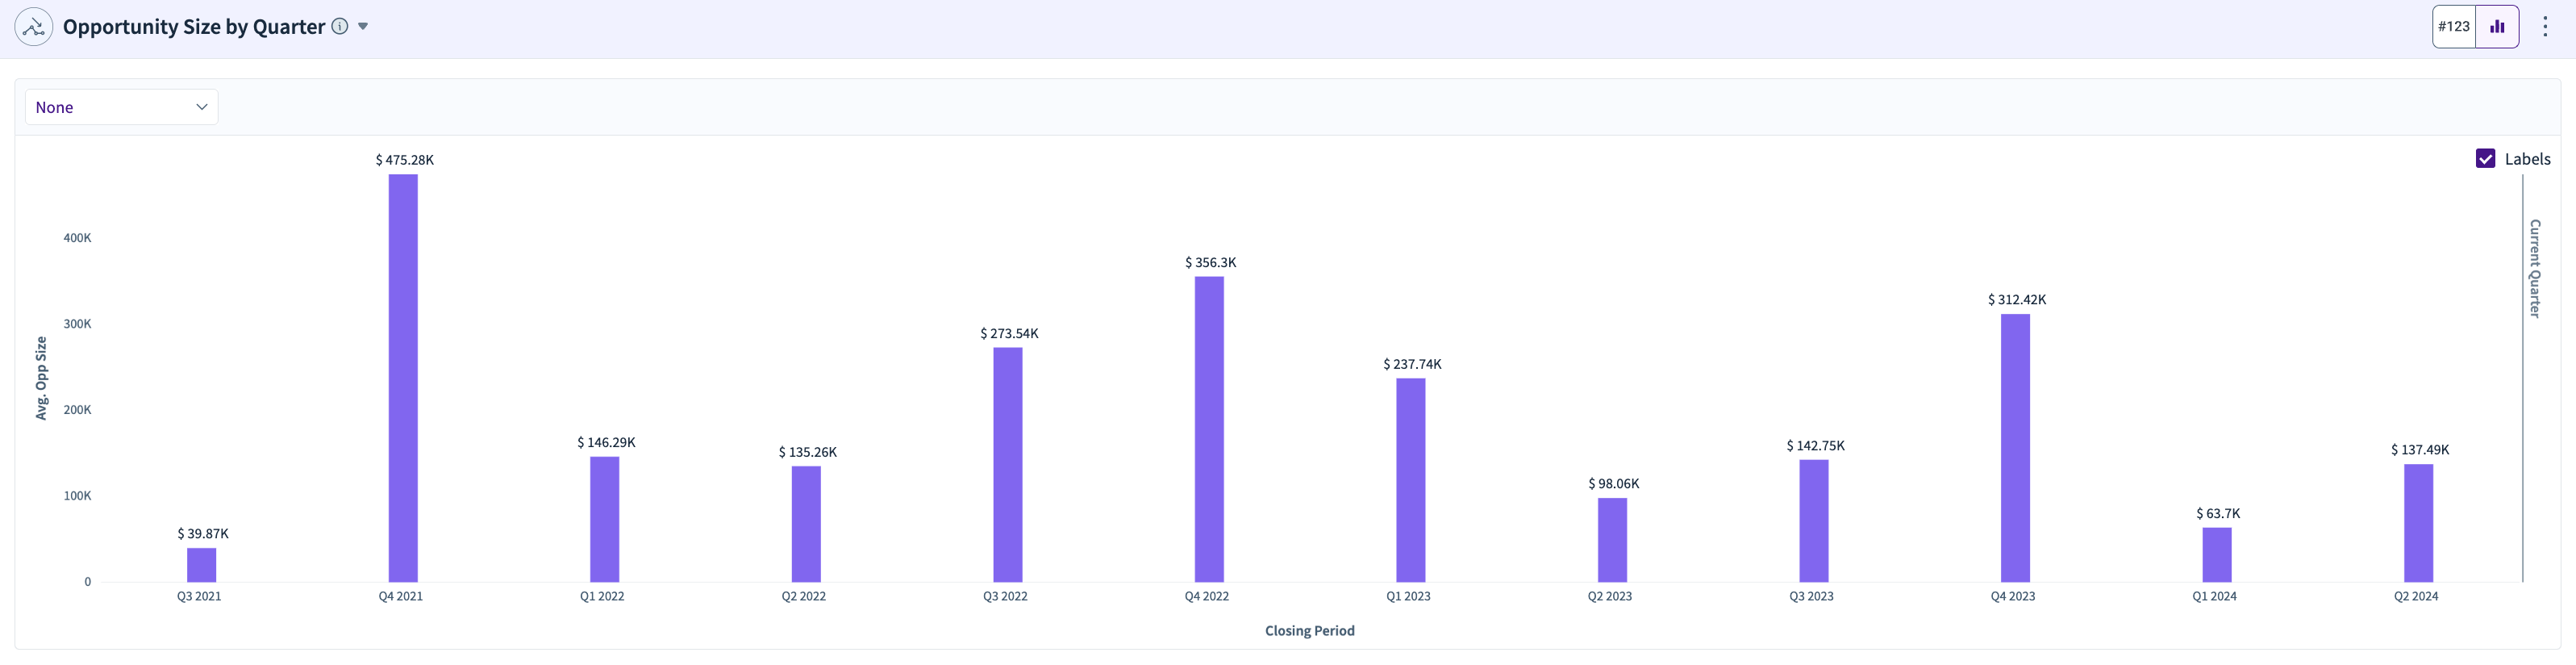
Opportunity Size by Quarter
This column chart shows average opportunity sizes by closing quarter with a split option. This is calculated as the Value of the Open/Closed Pipeline closing in each quarter / Volume of the Open/Closed Pipeline closing in each quarter.
For past quarters, it shows the average opportunity size that closed. And for current and future quarters, it is the average opportunity size of the opportunities that are open for closure in those respective quarters.
Pipeline on Day 'X' of Quarter
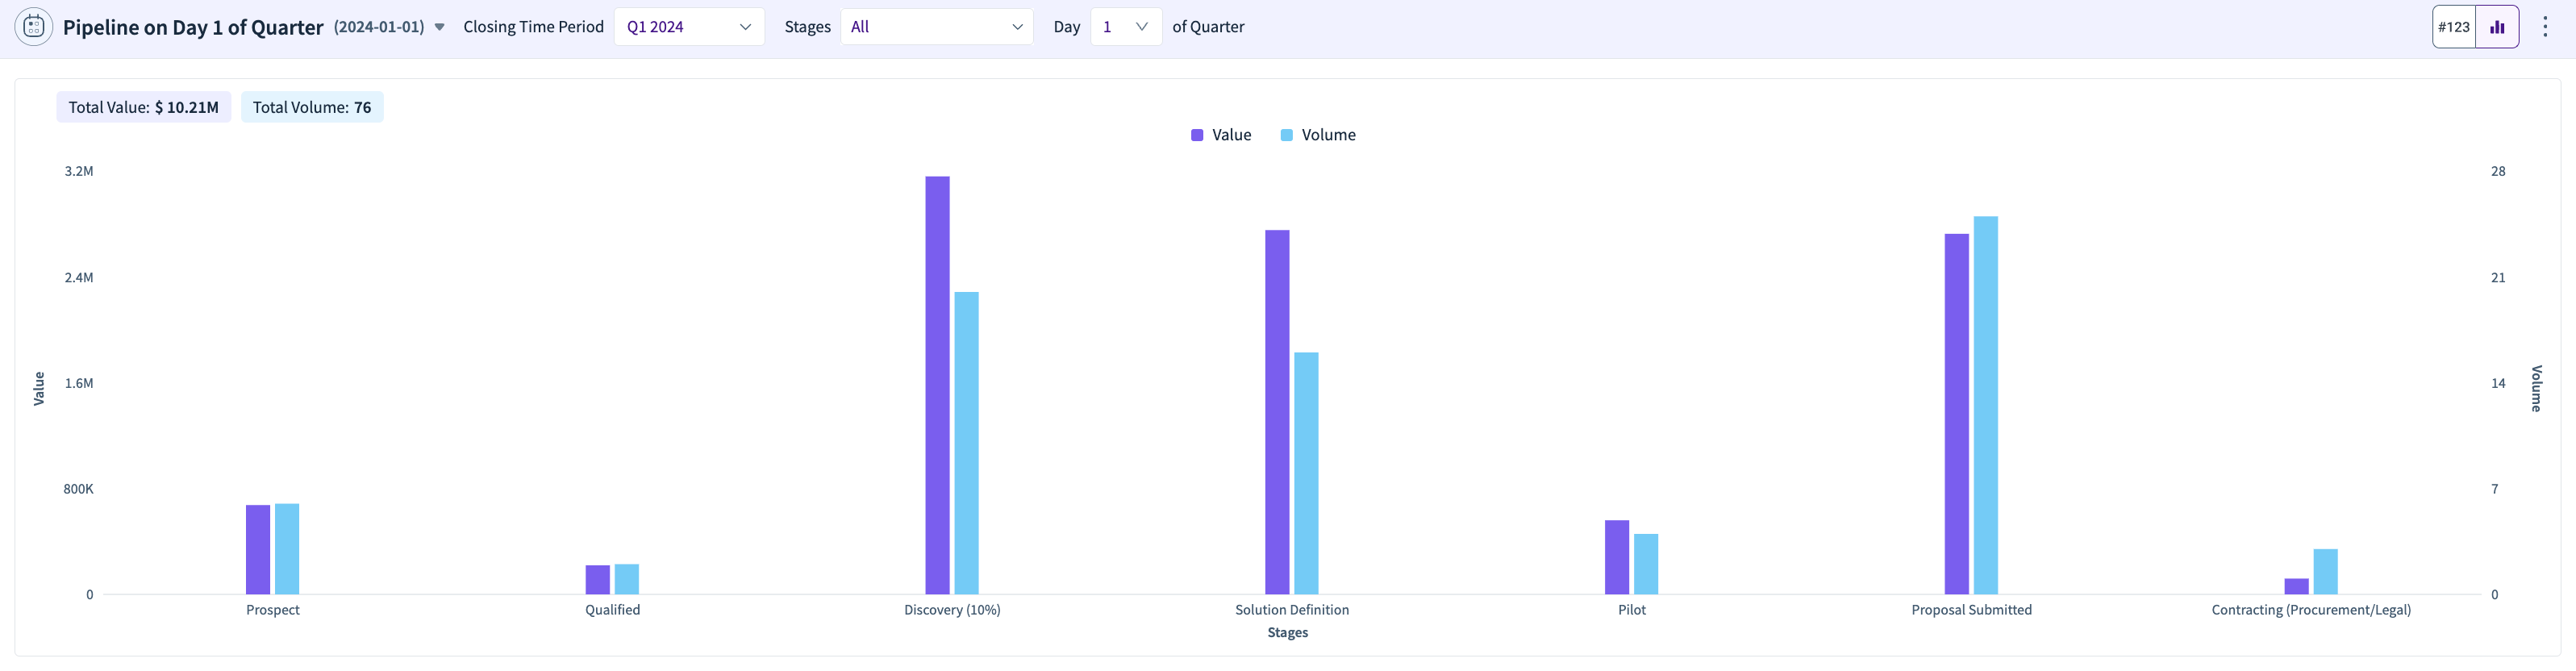
This chart shows how the various pipeline stages looked on the Day 'X' of a particular quarter. The quarter you want to view can be selected from the dropdown, and it could be any quarter in the past.
You can also select the opportunity stage(s) to view. You can toggle between the chart view and the table view.
Daily Booking Trends by Quarter
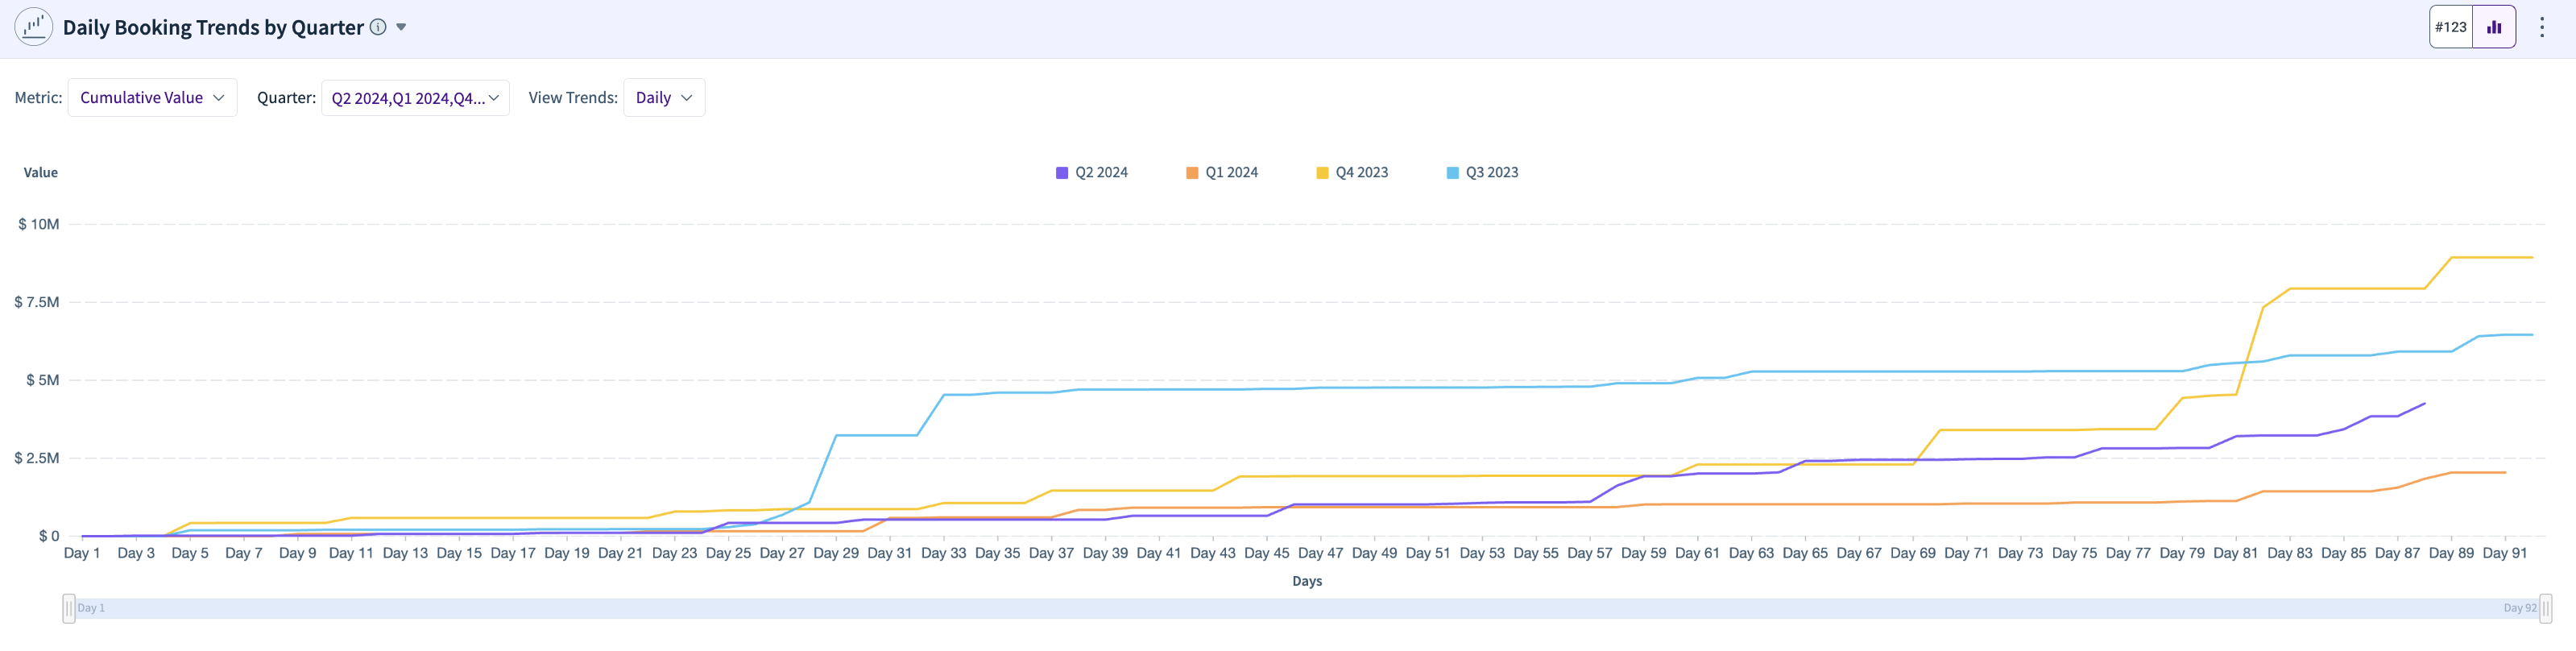
This chart shows the Booking trends daily for a choice of multiple quarters and lets you compare the booking trends for multiple quarters.
You can view it in terms of value or volume by selecting the respective option. The trends can be viewed by either cumulative booking or relative booking in terms of value or volume, or in terms of absolute or percentage numbers.
There is an option to see both a column chart and a line chart.
Daily Pipeline Generation Trends by Quarter
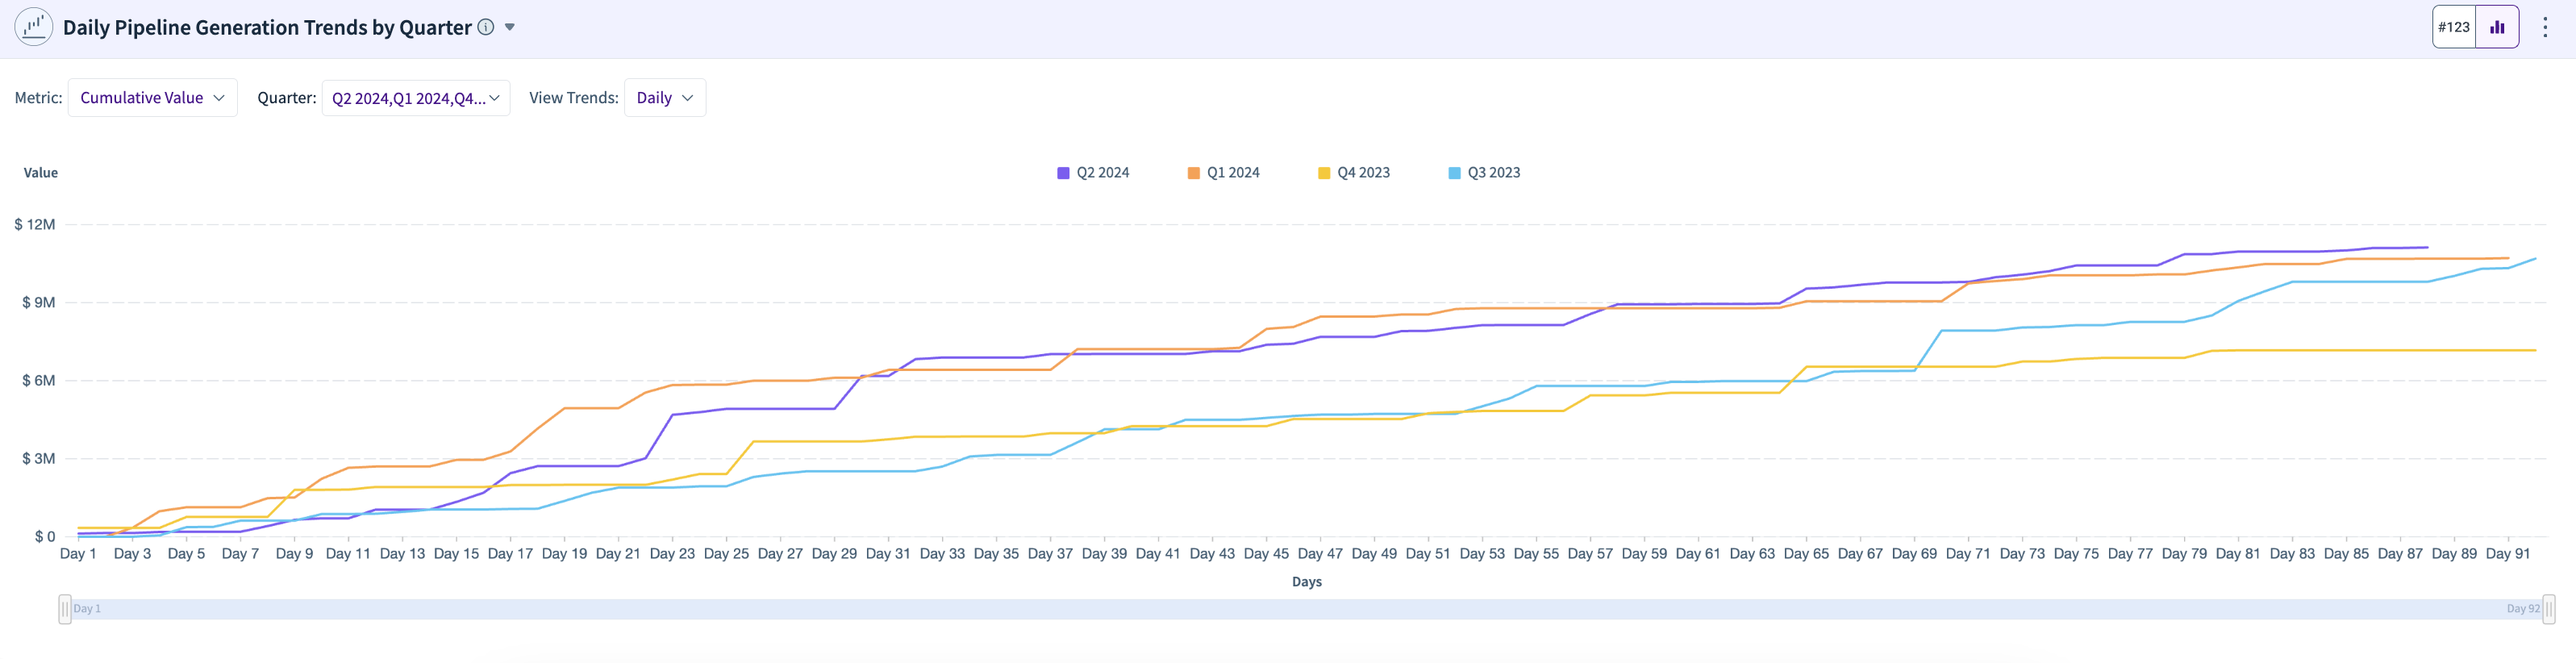
This chart shows the daily pipeline generation trend for multiple quarters and lets you compare the generation trends for multiple quarters.
You can view it in terms of value or volume by selecting the respective option. The trends can be viewed by either cumulative pipeline generation or relative pipeline generation in terms of value or volume, or in terms of absolute or percentage numbers.
There is an option to see both a column chart and a line chart.
Pipeline & Booking Analytics Metrics
Helps you understand the various pipeline and Booking metrics such as Pipeline Generation, New Logo Booking, Starting Pipeline, Starting Pipeline Coverage, Starting Pipeline Win rate, etc., and shows the Pipeline Generation as part of your goal/Target.
New Logo Booking - Generated Booking in a Quarter where the definition of filter from “New Business” is configurable via Definitions Configuration
Starting Pipeline - Walk-In Pipeline for the quarter
Starting Pipeline Coverage - Walk-in Pipeline Coverage for the quarter. (Walk in Pipeline / Pipeline Readiness Target)
Starting Pipeline Conversion - Same as Walk-in Pipeline Win Rate
.png)
Cumulative Conversion Trends
An advanced version of the conversion trends widget, which helps you determine which pipeline created in each quarter gets converted at the end of each subsequent quarter.
This widget contains the pipeline created in a quarter, determined by the created period selection, with the volume and value, and the average size. It also gives you how much of that pipeline has been converted as of a particular day, chosen by the Analysis as an on date selection.
Along with these two, it gives you what % of that pipeline is cumulatively converted in each of the following quarters from its creation. In the example below, Q+0 refers to what was the pipeline that closed in the respective created quarter, whereas Q+1 refers to the pipeline that closed at the end of the respective created quarter’s next quarter.
.png)