The Cohort Intelligence module helps you analyze your marketing campaigns against your KPIs to identify the trends and factors that affect your performance. It makes use of the Cohort analysis template and provides insights into the progression of cohorts to the final destination.
A cohort is a group that enters your customer journey during a specific time period. The module is a representation of how a cohort is moving through the revenue funnel. It helps you understand where visitors/customers are getting stuck and falling out, how quickly the group moves from one stage to another, and how many are still active in each stage of the funnel.
Key Features
Automated intelligence to drive better stage-by-stage conversion
Cohort analysis across the revenue funnel, not just marketing
Insights on specific actions to take on an opportunity
Funnel Tab
The Cohort Intelligence Module's Funnel Tab supports two types of analysis
Multiple Start Stage - Use this analysis to see how many leads have been generated in each stage, where they are now, and how many have leaked
Single Start Stage - Use this to understand cohort entries through a stage and the stage-by-stage journey of that cohort
You can define the cohort for which you want to analyze the data. A cohort is defined for a specific time period. The analysis will tell you how your cohort has performed as of a particular date.
Select the filters that you would like to apply to the cohort and click on Apply
Select a particular time period for which you want to view a cohort.
Select the period for which you want to view the trend.
Monthly, Quarterly, Weekly
Select the stage at which you want your cohort to start. A cohort can start at any stage of the funnel
Select the date on which you would like to see the state of the cohort
.png)
Multi Start Stage Analysis
This Analysis gives you what is generated in each stage, where they are now, and how many have leaked as of a particular date.
Suppose during a May-July 2022 campaign, you have added a lot of MQLs through Outbound Marketing, and you would like to analyze their Performance as of the End of 2022. In this case, select the time period of your cohort as May - July 2022, Select Outbound as a filter, Cohort start stage as MQL, and Open as on Dec 31, 2022.
Summary Section
The summary section gives information about how the cohort is performing, including their progression across the stages, trendlines of how they are evolving, and how much is the difference from the previous month or quarter.
.png)
The numbers in the summary section indicate the count of leads/opportunities in each stage of the funnel as of today. The trendlines indicate the count of leads at the end of each calendar month or quarter. The differences indicate the increase or decrease in the count of leads from last month to date and the Current month to date.
.png)
Funnel Visualization
The Cohort Funnel shows how many of your cohort entries are in what stages of the funnel today. You can change the funnel view by toggling between metrics using View by.
Split by - Gives you information on how much came from the inbound vs outbound, new vs upsell, sales vs marketing, or any other dimension
Metric - Toggle between the metrics - volume of leads or value of opportunities
Correlate With - Select a metric to correlate with the current primary metric—this highlights how they vary together across funnel stages
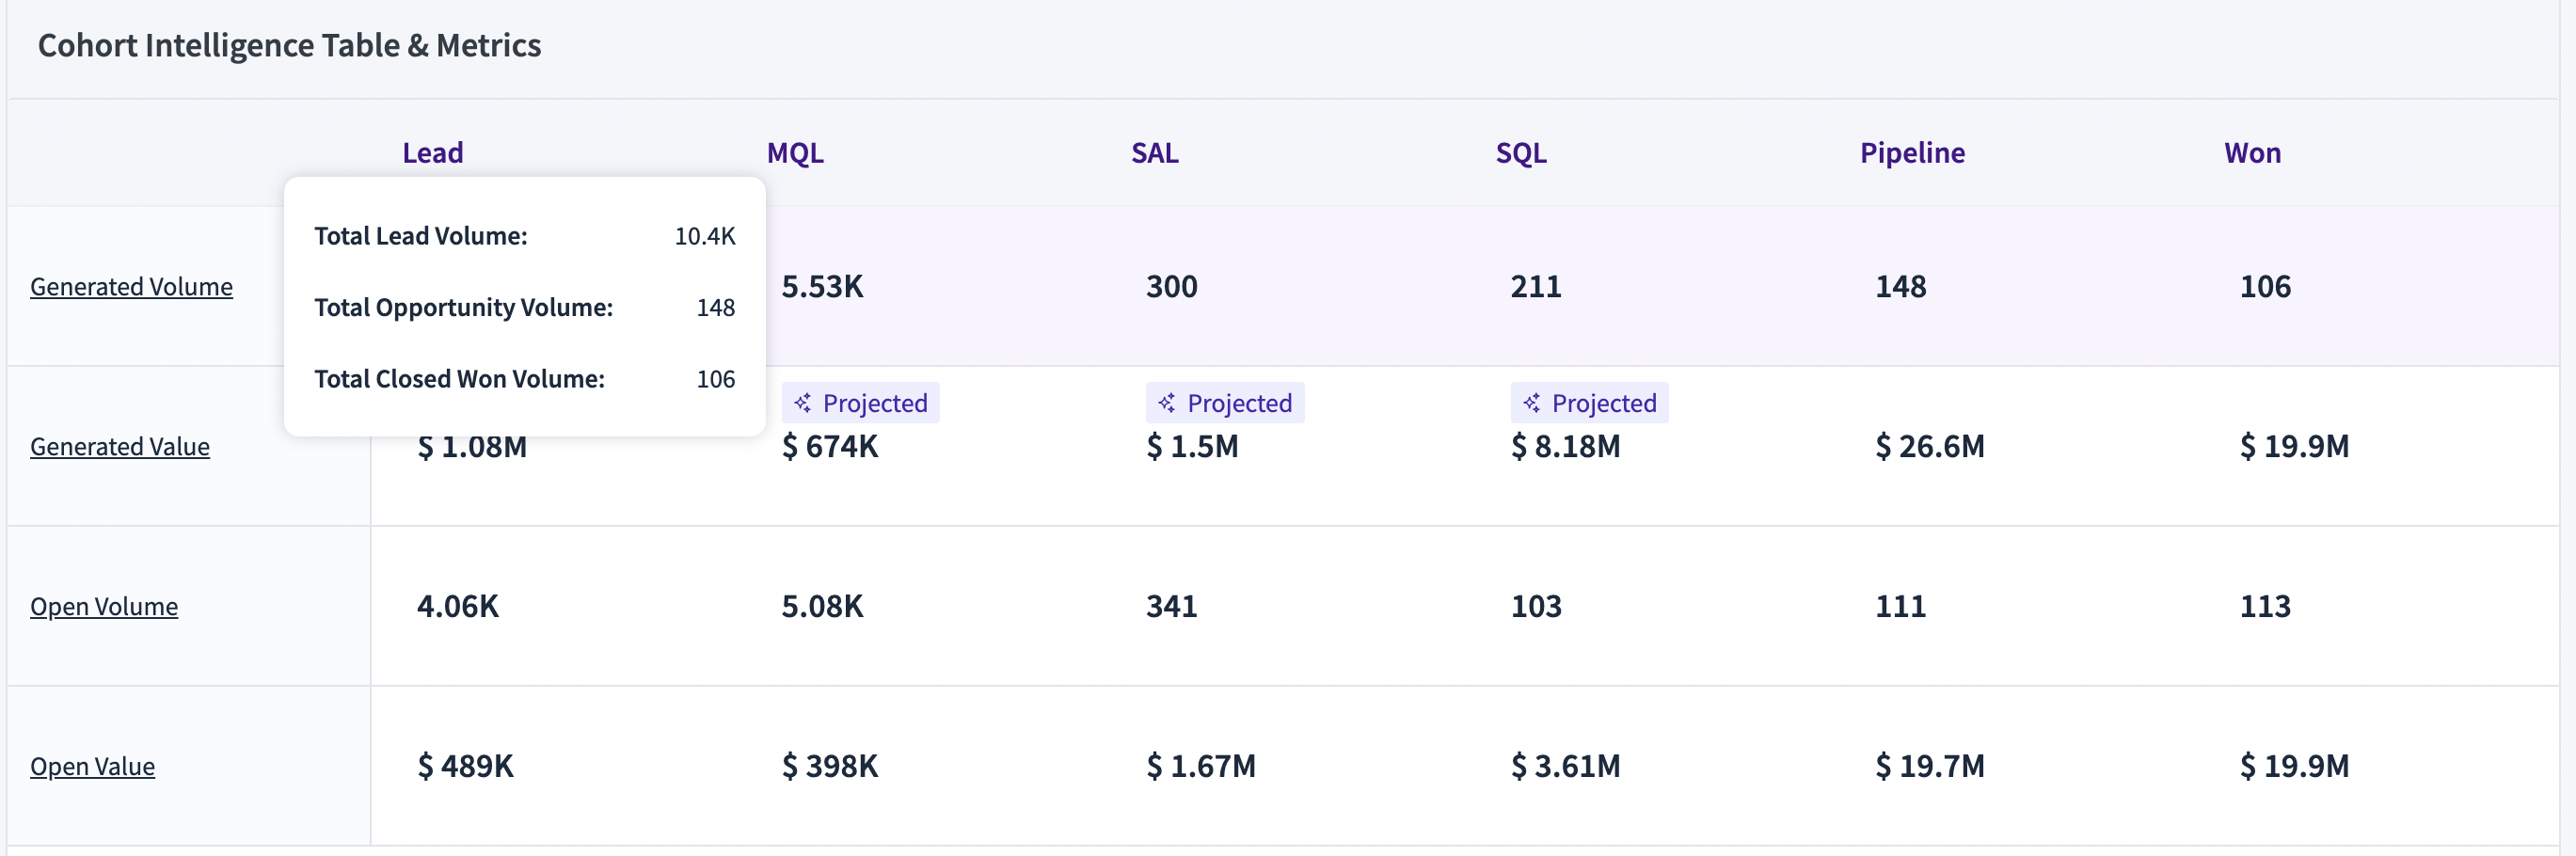
Funnel Table
Each column in the table is a stage in the funnel:
Generated Volume
Total Lead Volume - count of unique leads generated across lead stages
Total Opportunity Volume - count of unique opportunities generated across opportunity stages (excluding closed won)
Total Closed Won Volume - count of unique closed won opportunities
Generated Value
Total Lead Value - projected pipeline value of total lead volume (generated)
Total Opportunity Value - actual/projected pipeline value of total opportunity volume (generated)
Total Closed Won Value - actual value of total closed won volume (generated)
Direct Generated Volume
Total Lead Volume - count of unique leads generated across lead stages directly
Total Opportunity Volume - count of unique opportunities generated across opportunity stages directly(excluding closed won)
Total Closed Won Volume - count of unique closed won opportunities directly
Direct Generated Value
Total Lead Value - projected pipeline value of total lead volume (Direct generated)
Total Opportunity Value - actual/projected pipeline value of total opportunity volume (Direct generated)
Total Closed Won Value - actual value of total closed won volume (Direct generated)
Open Volume
Total Lead Volume - the sum of lead volume open in all lead stages
Total Opportunity Volume - the sum of open opportunity volume in all opportunity stages
Total Closed Won Volume - count of unique closed won opportunities
Open Value
Total Lead Value - projected pipeline value of total lead volume (open)
Total Opportunity Value - actual/projected pipeline value of total opportunity volume (open)
Total Closed Won Value - actual value of total closed won volume (open)
Duration in Stage
The number of days spent by the open leads or opportunities in the respective funnel stages
Converted Volume from Stage
End-to-End Converted Volume - The count of volume of leads that converted from the first stage to the last stage
Converted Value from Stage
End-to-End Converted Value - The sum of the value of leads that converted from the first stage to the last stage
Stage to Stage Conversion
End-to-End Conversion% - The % of leads that converted from the first stage to the last stage
Stage to Stage Velocity
End-to-End Velocity - The average number of days spent by the leads to move from the first stage to the last stage
Stage to Stage Median Velocity
End-to-End Median Velocity - The median number of days spent by the leads to move from the first stage to the last stage
Leakage Volume
Total Lead Volume - count of unique leads leaked across lead stages
Total Opportunity Volume - count of unique opportunities leaked across opportunity stages
Leakage Value
Total Lead Value - projected pipeline value of total lead volume (leaked)
Total Opportunity Value - actual/projected pipeline value of total opportunity volume (leaked)
Single Start Stage
This Analysis lets you analyze what moved from one stage to another stage, out of a particular cohort, and understand the quality of your cohort.
In the same way as above, define your cohort using the filters and time period. Select which stage of cohort entries you would like to analyze.
Summary Section
The summary section gives information about how much volume has been generated out of the cohort, and from that volume, how many progressed to the future stages from the created cohort, both directly and indirectly through other stages.
.png)
Funnel Visualization
The Cohort Funnel shows how many of your cohort entries progressed from the created stage to future stages. You can change the funnel view by toggling between metrics using View by.
Split by - gives you information on how much came from the inbound vs outbound, new vs upsell, sales vs marketing, or any other dimension
View By- Toggle between the metrics - volume of leads or value of opportunities
Correlate With - Select a metric to correlate with the current primary metric—this highlights how they vary together across funnel stages
Funnel Table
Each column in the table is a stage in the funnel:
Name | Description |
|---|---|
Generated Volume | Number of leads or Opps created in that stage for the first time during the period |
Generated Value | Actual or Projected $ value of Generated Volume |
Generated Account Volume | Unique Number of Accounts from the Generated Volume |
Progressed Volume (From Created Stage) | From the start stage volume, the number of leads or opportunities seen in that stage, as on the given date from the start date of the created period. It includes both direct and indirect conversions from the start stage. |
Progressed Value (From Created Stage) | Actual or Projected $ value of Progressed Volume (From Start Stage) |
Progressed Account Volume (From Created Stage) | Unique Number of Accounts from the Progressed Volume (From Start Stage) |
% Progression (From Created Stage) | % of Leads that progressed to a stage from the created stage Calculated as (Progressed Volume (From Created Stage) / Generated Volume) |
Progressed Velocity (From Created Stage) | Average Time taken by the leads in Progressed Volume (From Created Stage) to move from the created stage to the particular stage |
Progressed Median Velocity (From Created Stage) | Median Time taken by the leads in Progressed Volume (From Created Stage) to move from the created stage to the particular stage |
Progressed Volume (From Previous Stage) | From the start stage, the number of leads directly moved to the next stage, and from that stage, what directly moved to the next stage, and so on. Includes only the leads who moved from the previous stage. This should be the same as the progression data in the CI - progression tab. |
Progressed Value (From Previous Stage) | Actual or Projected $ value of Progressed Volume (From Previous Stage) |
Progressed Account Volume (From Previous Stage) | Unique Number of Accounts from the Progressed Volume (From Previous Stage) |
% Progression (From Previous Stage) | % of Leads that progressed to a stage from the created stage Calculated as (Progressed Volume (From Previous Stage) / Generated Volume) |
Progressed Velocity (From Previous Stage) | Average Time taken by the leads in Progressed Volume (From Previous Stage) to move from the previous stage to the particular stage |
Progressed Median Velocity (From Previous Stage) | Median Time taken by the leads in Progressed Volume (From Previous Stage) to move from the created stage to the particular stage |
Progressed Volume (To Subsequent Stages) | From the progressed Volume (From the Start Stage), the number of leads moved to the subsequent stage from that stage. It includes those leads from the start stage that were seen in that stage and progressed to any of the subsequent stages. This does not include volume that regressed from forward stages. |
Progressed Value (To Subsequent Stages) | Actual or Projected $ value of Progressed Volume (To Subsequent Stages) |
Progressed Account Volume (To Subsequent Stages) | Unique Number of Accounts from the Progressed Volume (To Subsequent Stages) |
Regressed Volume (To Prior Stages) | From the Progressed Volume (From the Start Stage), the number of leads that regressed to any of the previous stages. |
Regressed Value (To Prior Stages) | Actual or Projected $ value of Regressed Volume (To Prior Stages) |
Regressed Account Volume (To Prior Stages) | Unique Number of Accounts from the Regressed Volume (To Prior Stages) |
Leakage Volume from Stage | From the Progressed Volume (From the Start Stage), the number of leads that leaked from that stage |
Leakage Value from Stage | Actual or Projected $ value of Leakage Volume from Stage |
Leakage Account Volume from Stage | Unique Number of Accounts from the Leakage Volume from Stage |
Current Volume in Stage | From the Progressed Volume (From the Start Stage), the number of leads that are still open in that stage |
Current Value in Stage | Actual or Projected $ value of Current Volume in Stage |
Current Account Volume in Stage | Unique Number of Accounts from the Current Volume in Stage |
Progression Tab
The Progression Tab analyzes cohort progressions and compares outcomes from different cohorts.
Define your cohort using the filters and time period. Select which stage of cohort entries you would like to analyze using Created Stage. Then, define what stages the progressions should have happened to using the Progressed Stages dropdown.
In the Progressed Period Filter, choose when the progression should have happened. Select a metric from Progressed Value, Volume, Value %, and Volume %.
For example, if you want to check which leads took the path of Leads->MQL->SAL->SQL->Pipeline->Closed Won, choose Leads as the Created Stage and the rest as the Progressed Stages. If you would like to see which leads were directly moved from Leads->SAL->Pipeline, choose only SAL and Pipeline in the Progressed Stages dropdown.
.png)
Summary Section
The Summary Section gives details about the number of leads and opportunities that directly moved to the next stage from the start stage, and from that stage, what directly moved to the next stage, and so on. Includes only the leads who moved from the immediate previous stage.
Click on each stage name to see the details of the leads and opportunities.
Comparison Table
The Comparison table shows a visualization of the leads that moved from one stage to another. It lets you compare the cohorts for two different time periods.
Choose a Created and Progressed Period to compare with and see a comparison view of the cohort, but across two time periods.
.png)
Conversion Trends
The Conversion Trends tab is a great way to analyze the cohort of leads and opportunities generated in a quarter. The analysis can be carried out as of a particular day or at the end of the corresponding quarter.
To set up the cohort, pick the filters and the period for which the leads or opportunities should have been created. This period will be divided into respective quarters. You can see the output by volume or value.
The Conversion trend widget shows you what was
Created - Volume or Value created in a stage in the quarter
Progressed - Volume or Value that progressed to any of the subsequent stages
Regressed - Volume or Value that regressed to any of the previous stages
Open - Volume or Value that is open as of the analysis date in that stage.
Leaked - Volume or Value that dropped off from the funnel from any of the stages.
This analysis can be split into up to 2 dimensions. Here’s an example of the analysis fro 1 split.

Switch to the chart view to see the analysis in a graphical view.
.png)