RevSure provides various widgets to assess the health of your funnel at any given point in time. Knowing the health of your funnel, the factors driving it, the conversion rates, trends, and how all of this tracks against the targets is very important to take proactive actions. Below are various widgets that help you assess the health of your funnel.
About Widgets
Most widgets offer multiple views, such as charts and tables. These can be toggled from the top-right side of every widget near the 3-dots menu.
Also, every widget is independent of other widgets. You can make multiple copies of the same widget using the 3-dot menu. These copies are independent of each other. At the time of making a copy of any of the widgets, the selected filters are also copied to the new widget. However, since these 2 widgets are not connected, you can change the filters and other settings of either of the widgets without affecting the other one.
Funnel Health Overview
The Funnel Health Overview shows you the key metrics of your funnel. The ‘Filters’ section allows you to filter the data further. It contains the following filter categories:
Filters: Select any of the data dimensions to filter the data and metrics being shown in the widget
Period: Select a period to view data and metrics. It consists of some commonly used periods like weeks, months, quarters, and years. Additionally, you can also select a custom data range.
Consider only the First movement: Sometimes leads move backwards in the funnel and then again move forward after some time. In such cases, for certain metrics, only the first forward movement is considered.
The ‘Compare With’ dropdown allows you to select a preset or custom period to compare the current funnel health metrics with those from an earlier period of the same duration. Let’s take an example to understand this better. Let’s assume that today is April 1 and you are viewing the funnel health metrics for the last quarter. The start date is January 1, and the end date is March 31. This is the period window for the data and metrics that will be shown in the widget. If you choose to compare it with ‘Last Week’, the period window will still be a quarter, but it will be moved back by 1 week. The start date becomes December 25, and the end date will be March 24th. In other words, the comparison is being done with the snapshot of data from the past of the same period window.

You can also use the ‘Metrics’ dropdown to select the data and metrics that you want to view in the widget. Below is the list of metrics available for selection:
Open Total Lead Volume: Displays the total number of leads currently in the marketing funnel across all lead stages.
Open Total Opportunity Volume: This shows the total volume of opportunities in the pipeline across all opportunity stages.
Booking Volume: Measures the total volume of bookings, indicating the success rate of converting opportunities into confirmed sales.
Open Pipeline Value: This represents the total value of the pipeline, allowing marketing leaders to assess potential revenue.
Projected Pipeline Value: Estimates the future value of the pipeline based on current trends, aiding in revenue forecasting.
Booking Value: Displays the total value of all confirmed bookings, highlighting revenue generated from marketing efforts.
Projected Booking Value: Predicts the future booking value, offering a projection of potential revenue from ongoing campaigns.
Generated Total Lead Volume: This shows the total number of leads generated within a specific period, tracking lead acquisition performance.
End-to-End Conversion %: Calculates the percentage of leads that convert through all stages of the funnel, providing a complete conversion overview.
End-to-End Velocity: Measures the speed at which leads move through the funnel, helping to identify bottlenecks and improve efficiency.
Avg. Duration in a stage: Displays the average time leads spend in each stage of the funnel, helping to optimize the lead journey.
Number of Accounts: This shows the total number of accounts in the system, providing a comprehensive view of the customer base.
Number of Leads with activities: Tracks the number of leads that have engaged in recent activities, indicating active engagement.
Number of Leads with no activities: Identifies leads with no recent activities, allowing for targeted re-engagement efforts.
Number of Leads with no activities in the last 48 hrs: Highlights leads that have been inactive for the last 48 hours, prompting timely follow-up actions.
Number of Accounts with activities: Shows the number of accounts with recent engagement, indicating active customer interest.
Number of Accounts with no activities: Identifies accounts with no recent engagement, allowing for proactive re-engagement strategies.
Number of Accounts with no activities in the last 48 hrs: Highlights accounts inactive for the last 48 hours, aiding in timely customer outreach.
Open Lead Value: Displays the total potential value of open leads, providing insight into potential revenue from leads in the funnel.
Open Lead Volume: This shows the total volume of open leads, helping to assess the overall lead pool.
Open MQL Value: This represents the potential value of open Marketing Qualified Leads (MQLs), indicating the revenue potential from qualified leads.
Open MQL Volume: Displays the total volume of open MQLs, providing a count of leads qualified by marketing.
Open Pre-SAL Value: Shows the potential value of leads in the pre-Sales Accepted Lead (SAL) stage, indicating pre-sales revenue potential.
Open Pre-SAL Volume: This represents the total number of leads in the pre-SAL stage, helping to assess the lead readiness for sales.
Open SAL Value: Displays the potential value of Sales Accepted Leads (SALs), providing insight into the revenue potential from sales-ready leads.
Open SAL Volume: This shows the total volume of SALs, indicating the number of leads ready for sales engagement.
Open SQL(Pipeline) Value: This represents the potential value of Sales Qualified Leads (SQLs) in the pipeline, indicating the revenue potential from highly qualified leads.
Open SQL(Pipeline) Volume: Displays the total volume of SQLs in the pipeline, helping to assess the number of leads ready for advanced sales stages.
Generated Lead Value: This shows the total value of generated leads, indicating the revenue potential from newly acquired leads.
Generated Lead Volume: Displays the total volume of generated leads, helping to track lead acquisition performance.
Generated MQL Value: This represents the total value of generated MQLs, indicating the revenue potential from newly qualified leads.
Generated MQL Volume: This shows the total volume of generated MQLs, helping to track the performance of lead qualification efforts.
Generated Pre-SAL Value: Displays the total value of leads in the pre-SAL stage, indicating the potential revenue from newly pre-qualified leads.
Generated Pre-SAL Volume: Shows the total volume of leads in the pre-SAL stage, helping to track the readiness of leads for sales.
Generated SAL Value: This represents the total value of SALs, indicating the revenue potential from newly accepted sales leads.
Generated SAL Volume: Displays the total volume of SALs, helping to track the number of leads accepted by sales.
Generated SQL(Pipeline) Value: Shows the total value of SQLs in the pipeline, indicating the revenue potential from highly qualified and pipeline-ready leads.
Generated SQL(Pipeline) Volume: Displays the total volume of SQLs in the pipeline, helping to track the number of leads in advanced sales stages.
Generated Closed Won Value: This represents the total value of leads that have been closed and won, indicating the revenue generated from successful conversions.
Generated Closed Won Volume: This shows the total volume of leads that have been closed and won, helping to assess the number of successful conversions.
Number of Leads with no activities: Identifies leads with no recent activities, allowing for targeted follow-up and re-engagement efforts.
Number of MQLs with no activities: Highlights MQLs with no recent activities, prompting timely engagement strategies.
Number of Pre-SAL with no activities: Identifies pre-SAL leads with no recent activities, allowing for proactive engagement before sales acceptance.
Pipeline & Booking Value of Funnel
This widget gives us the potential of the funnel. It starts with giving us the values for the current quarter and also has cards with metrics for subsequent quarters. The metrics covered are:
Pipeline Generation Value: This is the pipeline that is generated from the funnel in the current quarter.
Projected Pipeline Value: This is the Pipeline that is projected to be added from the funnel this quarter
Pipeline Closure Value: This is the pipeline value that is forecasted to be added to the pipeline with the closing date this quarter
Booking Potential From Funnel: This is the booking potential that is forecasted to be closed this quarter from all the leads and all the pipeline stages combined.

Snapshot Funnel KPIs
This widget shows you the state of the open funnel and all the stages within it. You can select any of the metrics from the dropdown menu, and you can also split it by the second dropdown.
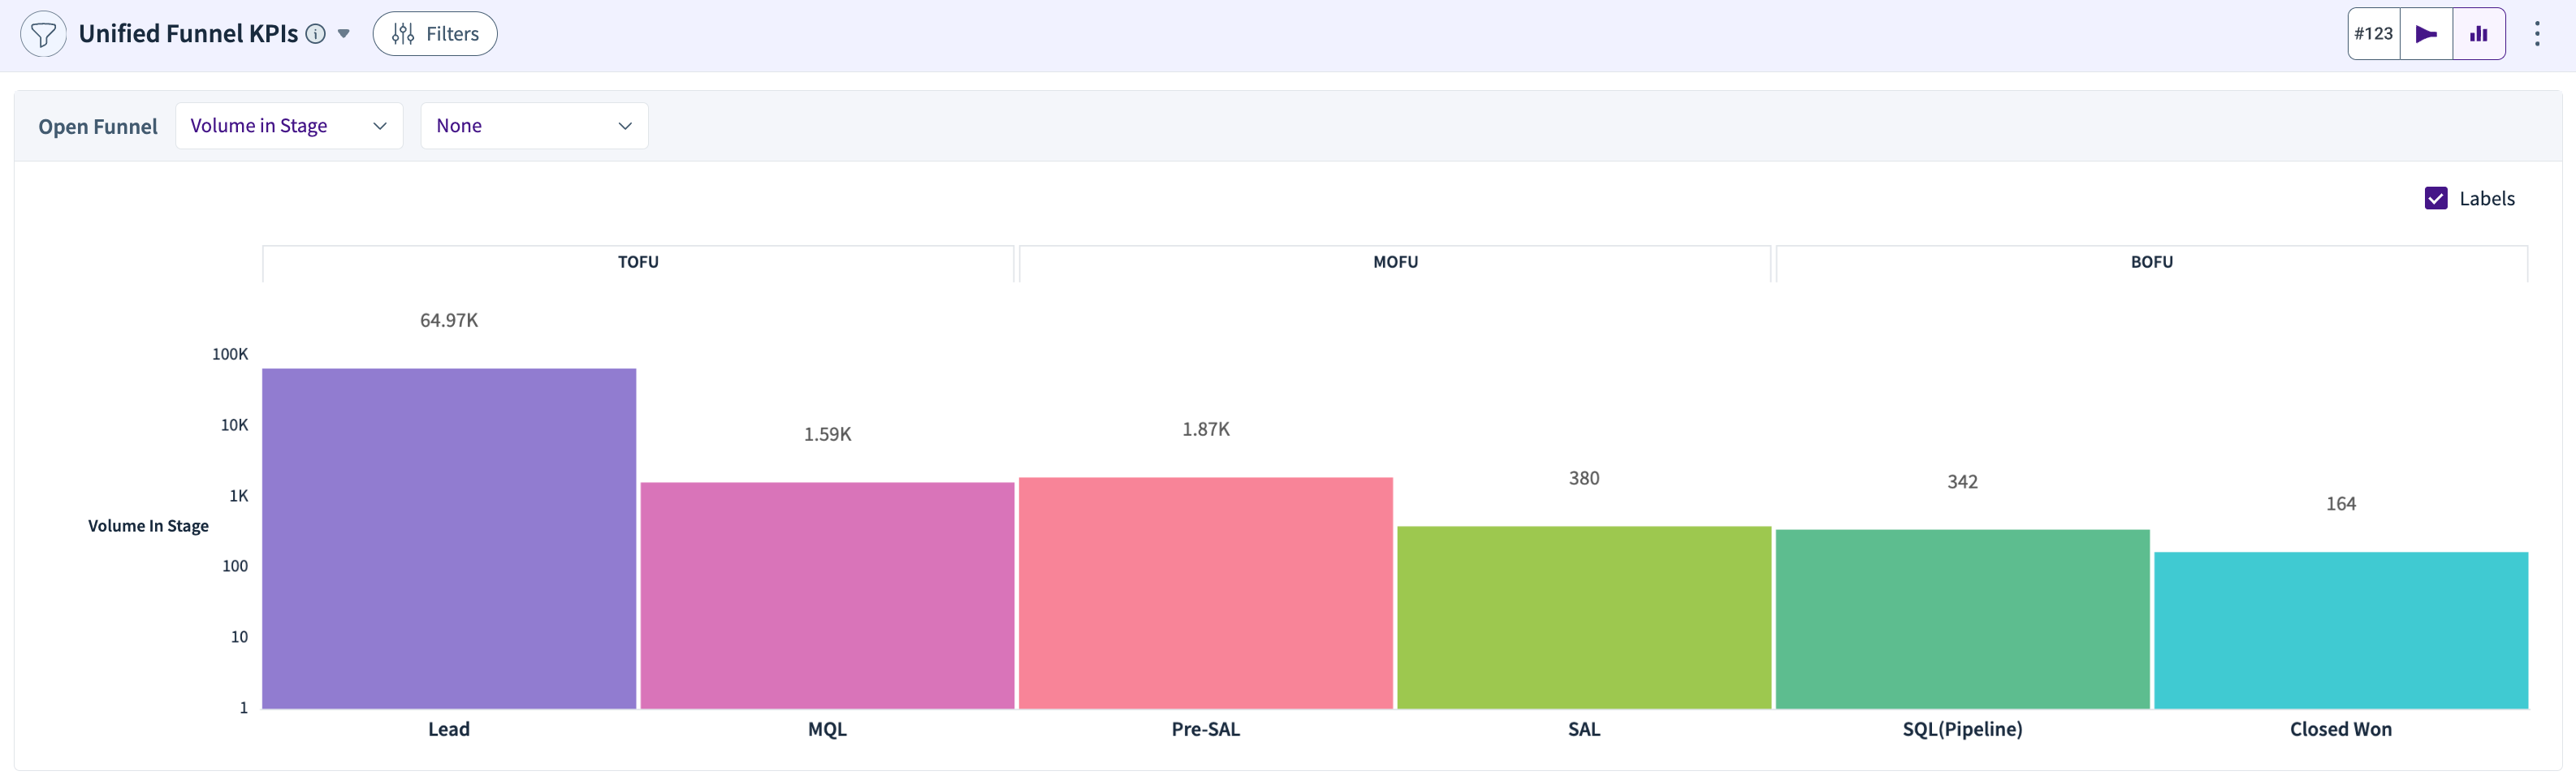
The various metrics in the ‘Open Funnel’ dropdown are:
Pipeline Value in Stage: Displays the total value of opportunities in the current stage of the pipeline, helping you assess potential revenue at specific points.
Booking Value in Stage: This shows the total booking value within the current stage, indicating the financial impact of deals at various stages of completion.
Account Volume in Stage: Represents the number of accounts in the current stage, providing insight into the distribution of accounts throughout the pipeline.
Converted Volume from Stage: Measures the volume of leads or opportunities that have successfully moved to the next stage, indicating conversion efficiency.
Converted Value from Stage: Displays the total value of leads or opportunities that have advanced to the next stage, highlighting the financial impact of conversions.
Leakage Volume from Stage: Tracks the number of leads or opportunities lost from the current stage, helping to identify and address potential drop-off points.
Leakage Value from Stage: This shows the total value of leads or opportunities lost from the current stage, indicating the financial impact of leakage.
Converted Account Volume from Stage: Measures the number of accounts that have successfully moved to the next stage, providing insight into account progression.
Number of Account activities: Displays the total number of activities associated with accounts, helping to track engagement and interaction levels.
Please note that when a new lead comes into the funnel, it doesn’t have a value associated with it. The value gets associated with a lead only when it enters the pipeline. Hence, the RevSure AI assigns a conservative value to a lead when it enters the funnel. This is done by our model by looking at various parameters and historical data.
Funnel Breakdown
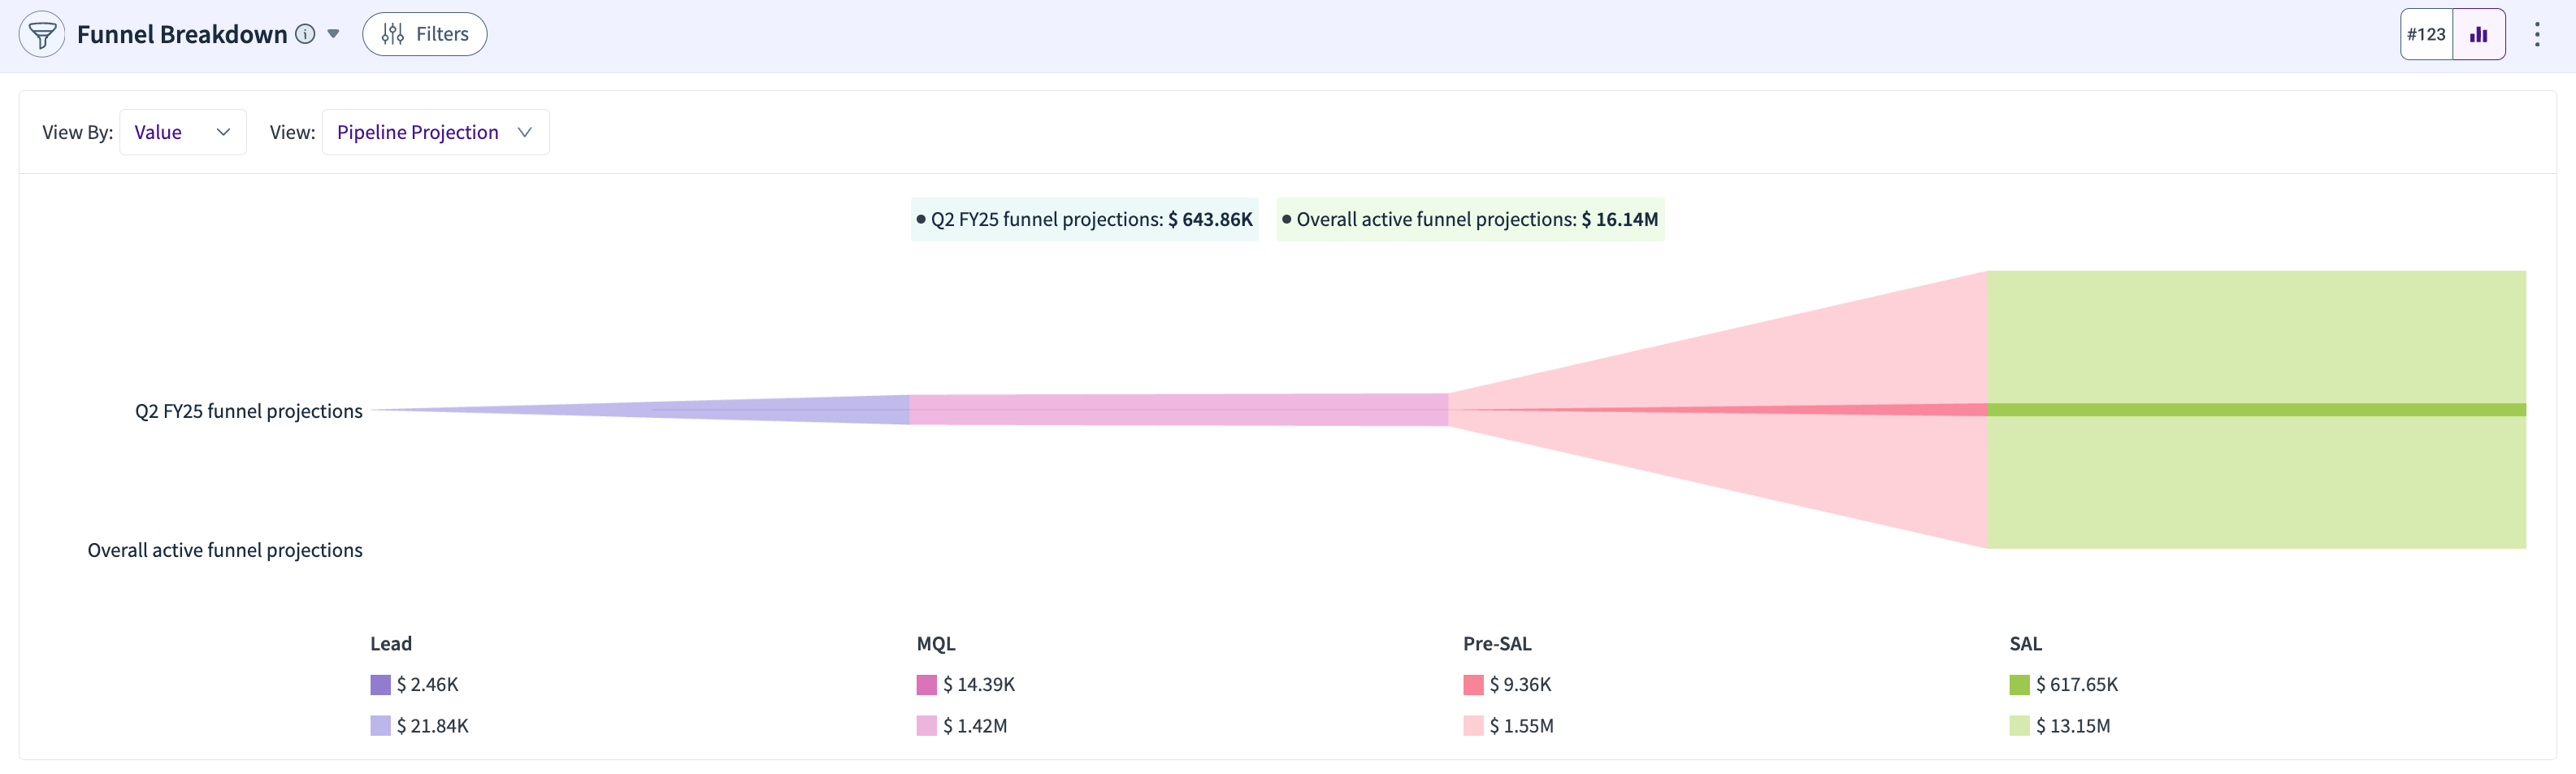
This widget shows you the current state of the funnel and also the projections for every stage in the funnel. You can view the funnel by ‘Value’ or by ‘Volume’. You can also choose the view to be either for ‘Pipeline Projection’ or for ‘Booking Projection’.
In the above chart (image), the darker colours in the chart legend show the current quarter’s potential; the lighter shades show the overall potential.
The ‘Filters’ section allows you to filter the data being shown for a particular data dimension.
Stage Deep Dive
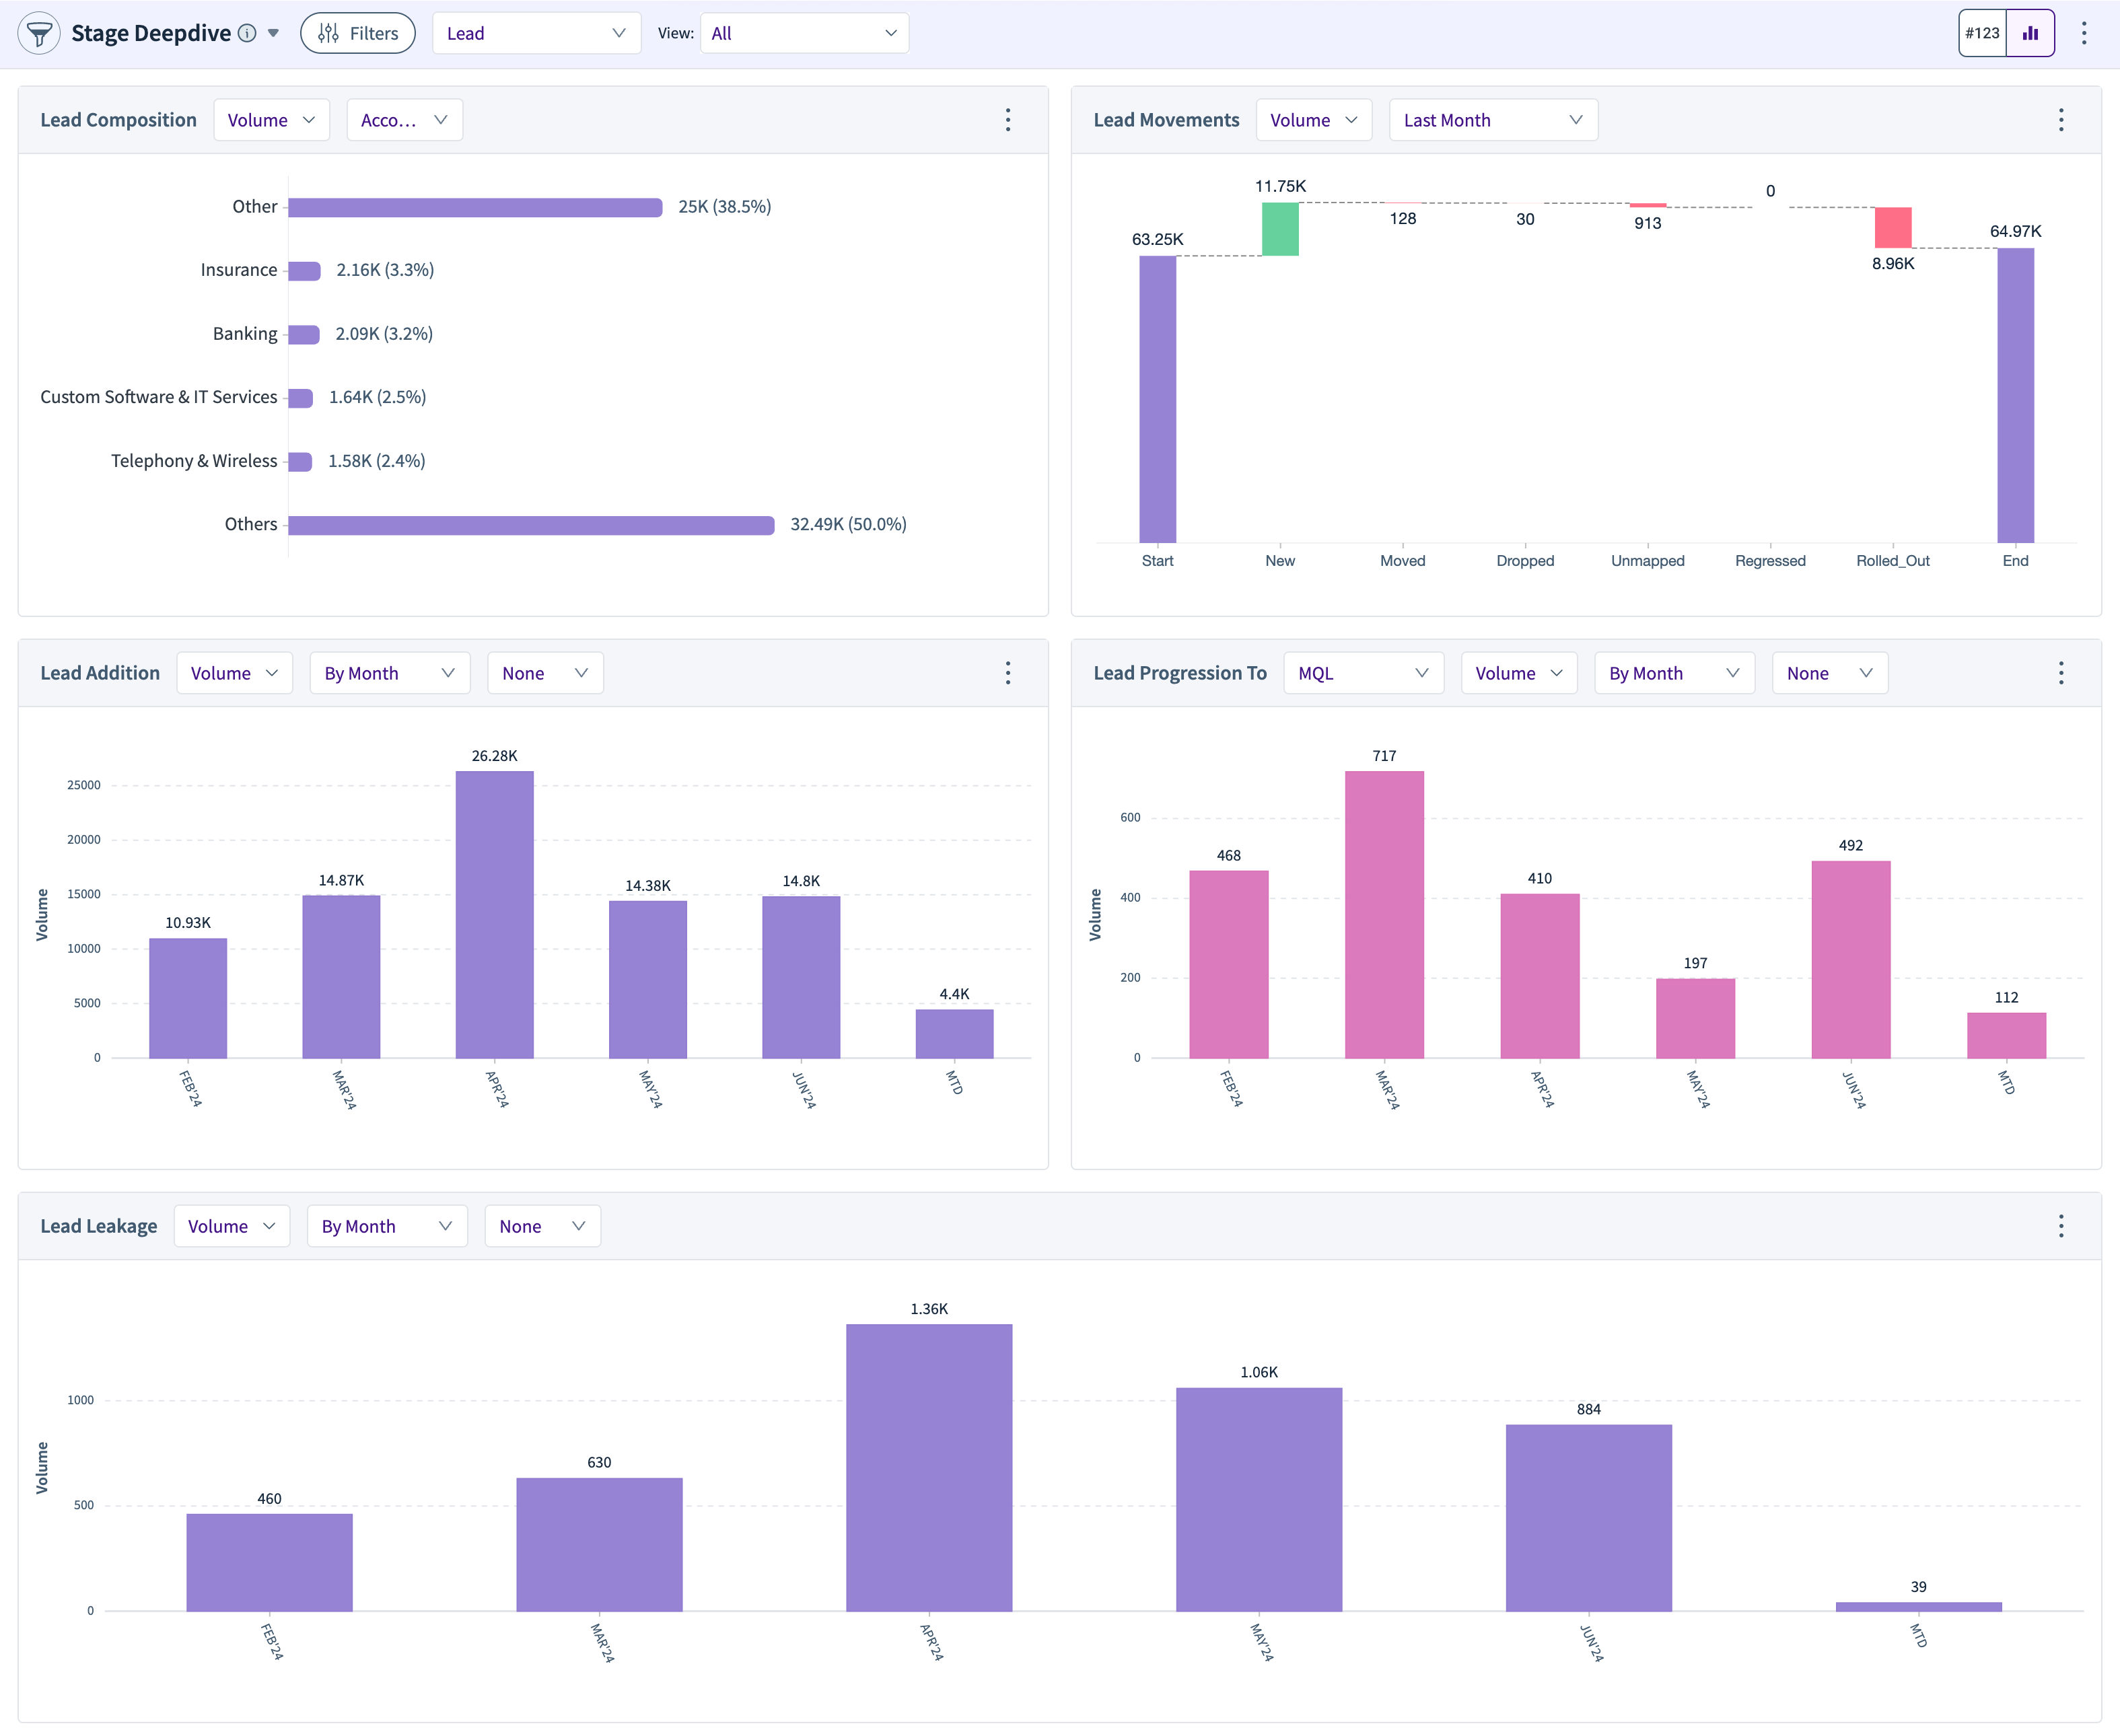
This widget allows you to deep dive into the stages of the funnel with more granularity. You should first choose any one of the stages in the funnel (e.g., MQL) and then select what views you want to see the charts for the selected stage. The available views are:
Composition - Tells you what the composition of the open <selected_stage> is. You can view the composition by multiple segments like Account Industry, Channel, Region etc., In the ‘Composition’ chart, the top 5 are shown, and all other factors are grouped in the “Others” category.
Movements - The Movements tab shows how the open leads/opps in the stage have evolved during the period from the last month/week/quarter to the current date. The stages include Start, New, Moved, Dropped, Unmapped, Regressed, Rolled_Out, and End.
Start indicates how much you started your rolling week/month/quarter with.
New indicates how much you added over the course of the rolling period
Moved shows the number of leads that progressed out of the stage
Dropped is the number of leads that got leaked
Unmapped indicates any movements to the states in the source system that are not mapped to the RevSure funnel stages
Regressed shows the number of leads that regressed to previous stage
Rolled_Out refers to leads that were counted as leads in the "start" but are no longer counted at the "end" because of the rolling window
Addition - Shows the trend of <selected_stage> that was generated in a given period. You can see a trend by week/month/quarter
Progression - Shows the trend of <selected_stage> that progressed to another stage, chosen with the help of a dropdown.
Leakage - Shows the trend of leads/opportunities that leaked from the selected stage.
Moreover, inside each chart, you can view it by ‘Value’ or ‘Volume’, select time period granularity, and split by a data dimension to further drill down and analyse.
Conversion Summary
This widget provides a summary of the conversion rates and the velocities. It does so by showing a few primary metrics for you to get a sense of how the conversion rate is and how long it takes for a lead/opportunity to convert.
End-to-End: This shows the conversion rate and velocity for a lead to enter a funnel and end in the Closed Won stage.
Lead to SQL (Pipeline): This shows the conversion rate and velocity for a lead from when it enters a funnel to the time when it enters the pipeline.
SQL (Pipeline) to Closed Won: This shows the conversion rate and velocity for a lead from when it enters the pipeline to when it reaches the Closed Won stage.
You can filter and drill down by using the data dimensions from the ‘Filter’ dropdown.

Conversion Deep Dive
.png)
The Conversion Deep Dive widget breaks down the conversion journey by every stage of your funnel. The first chart starts at the ‘Lead’ stage and shows the metrics for the movement to the subsequent stage. Similarly, the second chart shows the metrics for leads moving from the second to the third stage, and so on.
Each chart shows the conversion percentage numbers and the velocity as the two Y axes.
Funnel Addition Overview
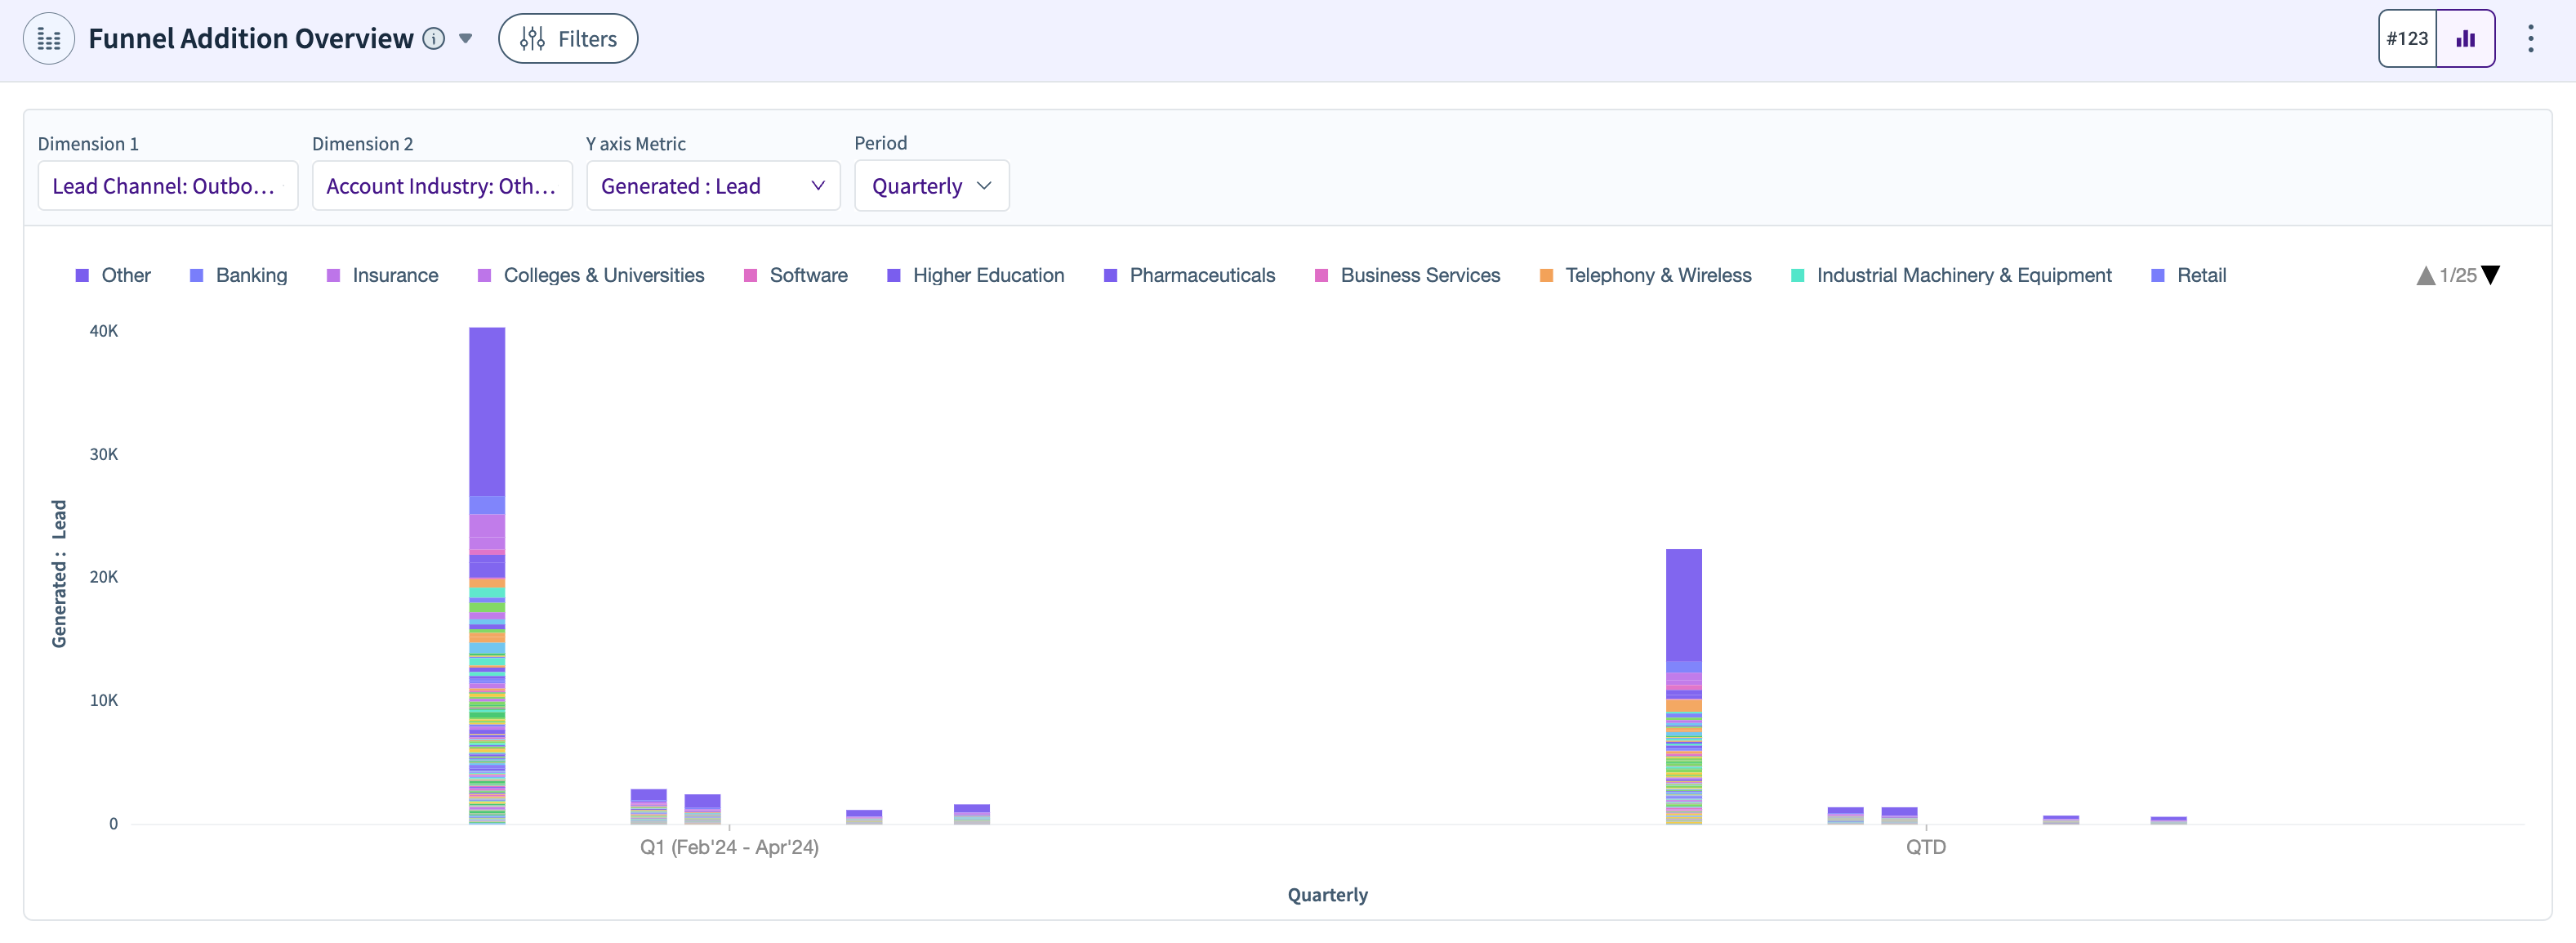
This widget shows how the leads are being added to the funnel for the various data dimensions. It allows you to select multiple options for ‘Dimension 1’ and ‘Dimension 2’. You can select the Y-axis metric from the dropdown and also the period for which you want to view the data.
Targets & Attainment
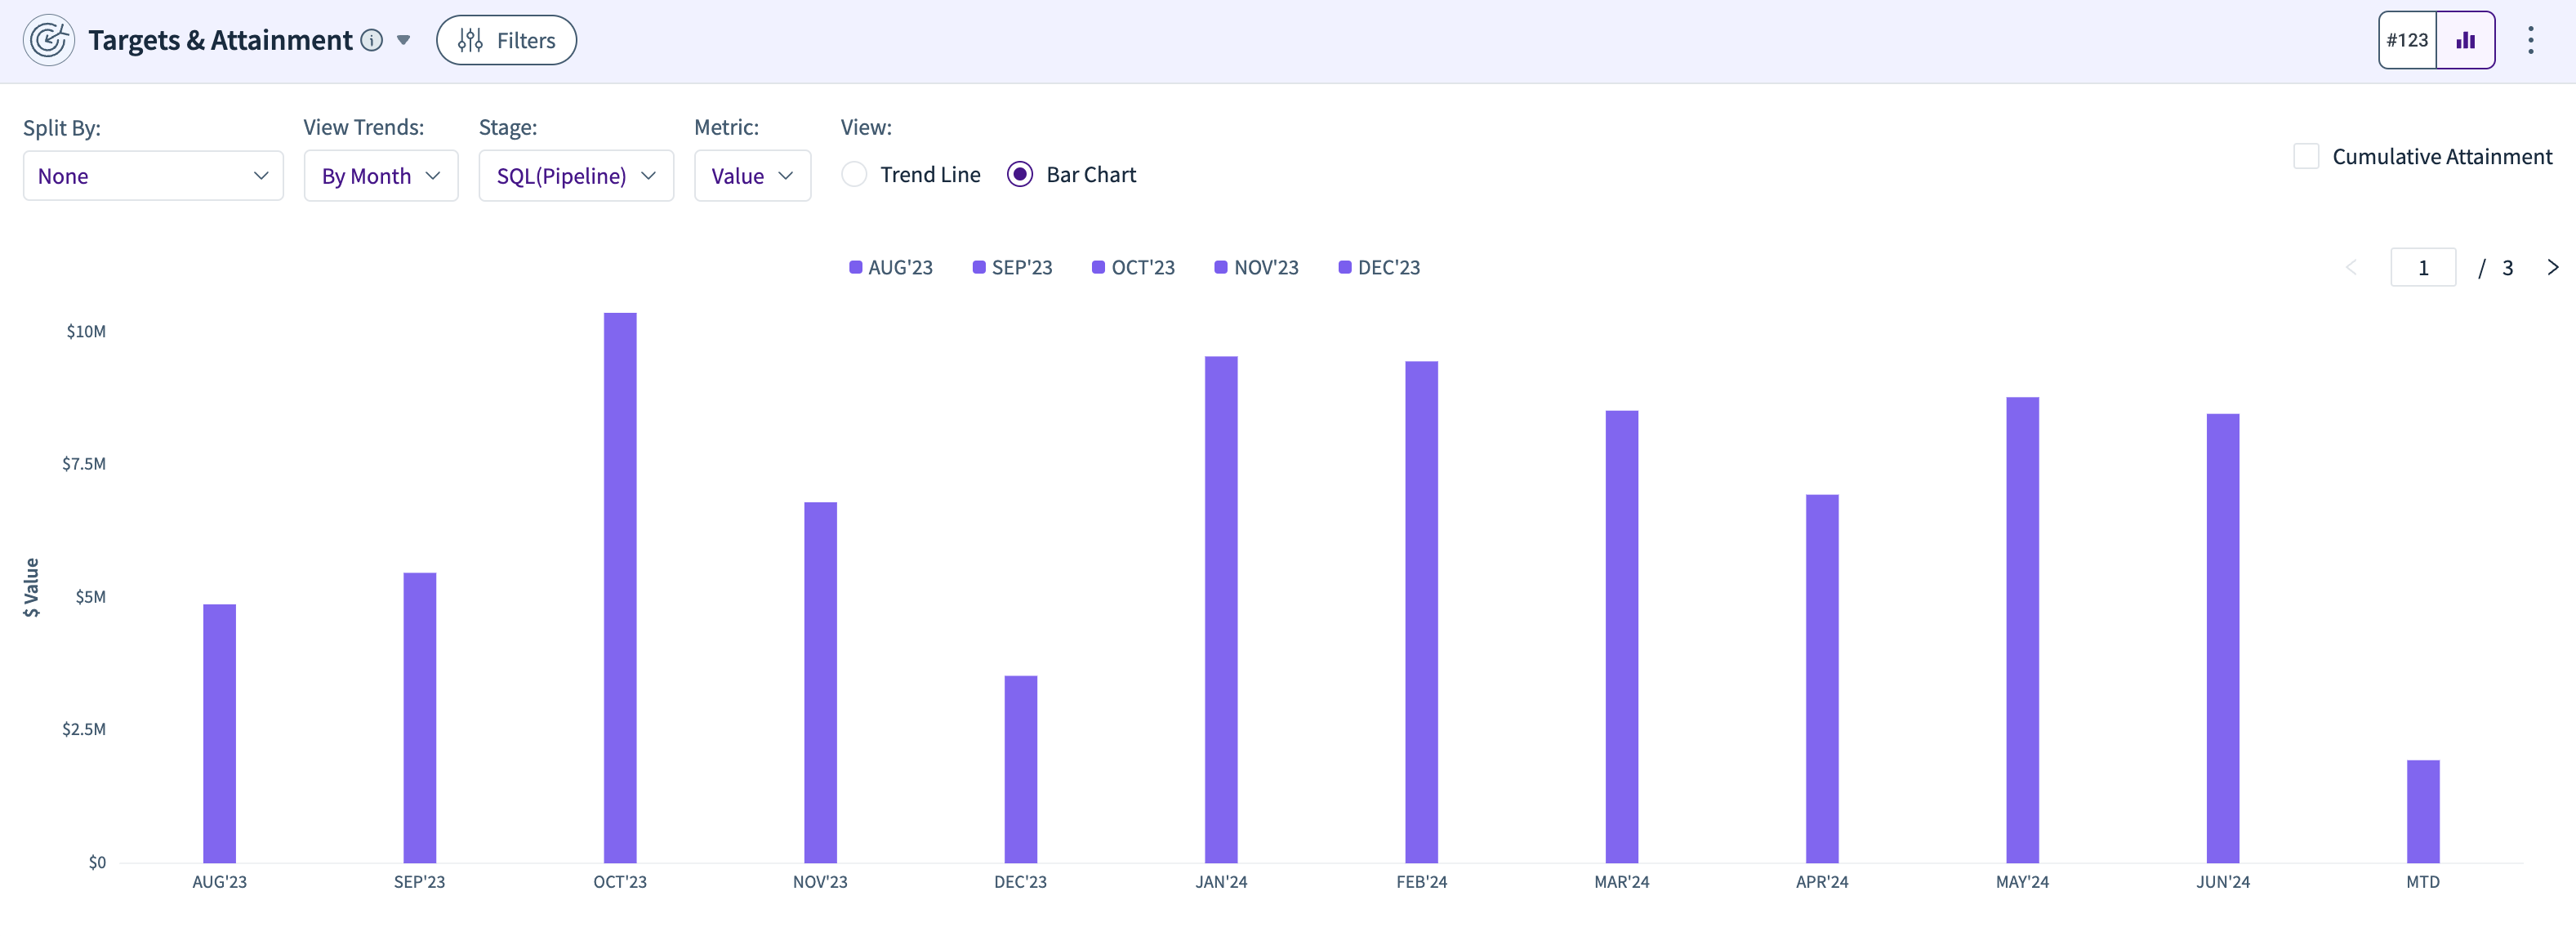
This chart shows how effectively you are attaining the targets on a daily/weekly/monthly basis for the selected stage of the funnel. You can view the chart as a bar graph or as a trend line chart.