The Web and Brand Dashboard provides a comprehensive view of web performance, brand visibility, and digital reach tracking website visitors, search interest, channel effectiveness, referral traffic, LLM performance, and keyword impact, enabling marketing and brand teams to measure digital presence, benchmark against competitors, and drive data-informed brand strategy.
Overview
Purpose
To deliver a unified view of web and brand health covering organic and paid search performance, website traffic trends, referral sources, LLM-driven traffic, visitor identity, and page-level journey insights tailored for brand, digital marketing, and growth teams.
Audience
CMOs & Brand Leaders → Monitor brand search trends and competitive positioning.
Marketing & Digital Teams → Track visitor volume, channel mix, and referral source performance.
Demand Generation & RevOps → Identify high-intent visitors and their journey paths.
Key Benefits
Performance Clarity → Consolidates organic, paid, referral, and LLM traffic in a single view.
Channel Optimization → Surfaces which channels, keywords, and referrers drive quality visitors.
Brand Intelligence → Tracks brand search interest vs. competitors over time.
Funnel Linkage → Exposes page-level journey paths linked to pipeline opportunities.
Global Filters
Timeframe (e.g., current fiscal year, custom date range)
Channel / Campaign filters
Funnel stage filters
Visitor / Lead segment filters
Tabs & Widgets Breakdown
Tab: Overview
Purpose: Executive-level summary of web search performance with quarterly and month-to-date metrics from Google Search Console. |
Widgets
Google Search
Metrics: Google Search Clicks, Impressions, CTR, Average Position.
Useful Insight: Provides a quick diagnostic of organic search health—clicks vs. impressions reveal CTR efficiency, while average position highlights ranking opportunities. QTD vs. prior quarter comparison enables trend monitoring.
Reference

Overview Tab – Google Search Widget
Tab: Search Interest
Purpose: Track and benchmark brand search interest against competitors using Google Trends data. |
Widgets
Google Trends – Interest Over Time
Visualization: Dual-line time-series chart comparing brand search interest vs. competitors over the current fiscal year.
Controls: Period, Brand, and Competitor selectors for on-the-fly benchmarking.
Useful Insight: Reveals how brand search momentum compares to competitors over time. Spikes and dips can be correlated with campaign launches, product news, or competitor activity.
Reference
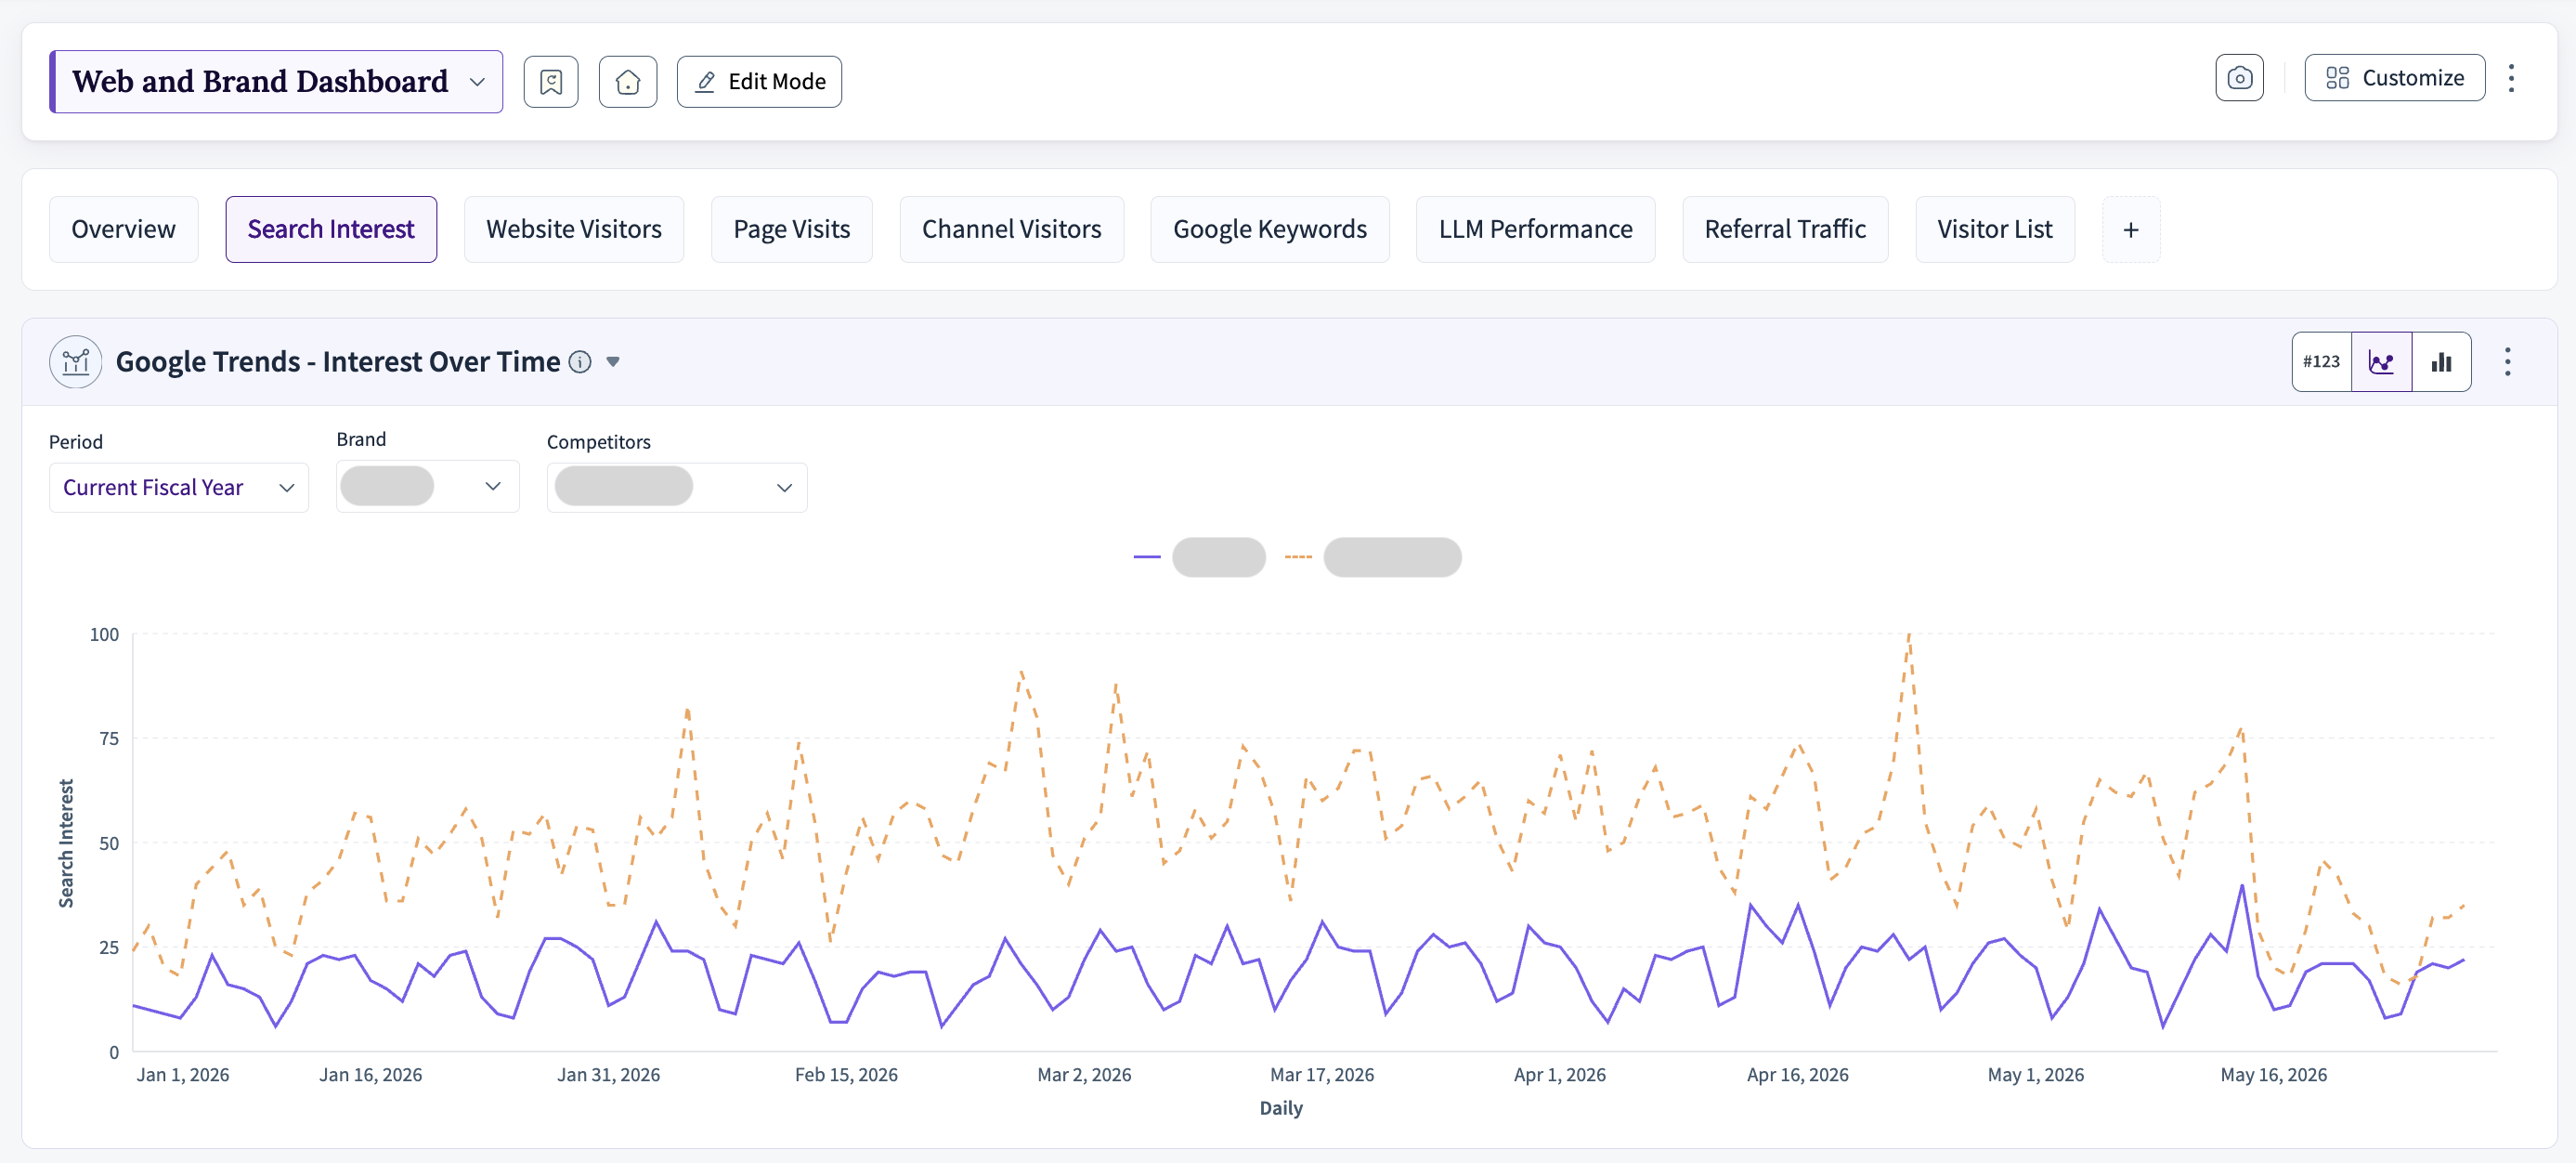
Search Interest Tab – Google Trends
Tab: Website Visitors
Purpose: Monitor monthly and cumulative website visitor volume trends across the fiscal year. |
Widgets
Website Visitors
Metrics: # of Visitors by time period (MTD, monthly breakdown, Overall).
View options: Monthly view with Split By dimension; Overall Summary toggle.
Useful Insight: Identifies monthly peaks and dips in website traffic (e.g., March '26 at 61.75K vs. April '26 at 46.48K) to correlate with campaign activity and seasonal patterns.
Reference

Website Visitors Tab
Tab: Page Visits
Purpose: Understand which web pages prospects visit, the sequence of those visits, and how page journeys link to pipeline opportunities. |
Widgets
Journeys (Summary KPIs)
Metrics: Number of Opportunities, # of Journeys, Avg. Steps Across Journeys, Avg. Cycle Time (days), Top 5 Touchpoints by Avg. Touches.
Useful Insight: Connects web engagement directly to pipeline. Top touchpoints (e.g., /pricing at 1.01, /demo at 0.88) reveal high-intent pages that drive conversions.
Journey Page Visit Paths
Views: Journeys, Touchpoints, and Opportunities tabs; groupable by Engagement Description or Engagement Name.
Useful Insight: Exposes common multi-step page visit sequences, cycle times, and their associated opportunity value enabling content optimization for high-converting paths.
Reference

Page Visits Tab – Journeys
Tab: Channel Visitors
Purpose: Evaluate visitor volume, spend, and funnel impact broken down by campaign channel. |
Widgets
Visitor Volume By Channel
Metrics: Spend, Visitor Volume, Generated Lead Volume, MQL/SQL Volume, Pipeline Value by Campaign Channel (e.g., Paid Search, Email Marketing, Organic Search).
Visualization: Funnel Snapshot Generated + MoM Cumulative Trends per channel.
Useful Insight: Paid Search dominates visitor volume (92.84K) with $6.86M spend, while Organic Search delivers 4.15K visitors at zero cost highlighting ROI differences across channels.
Reference
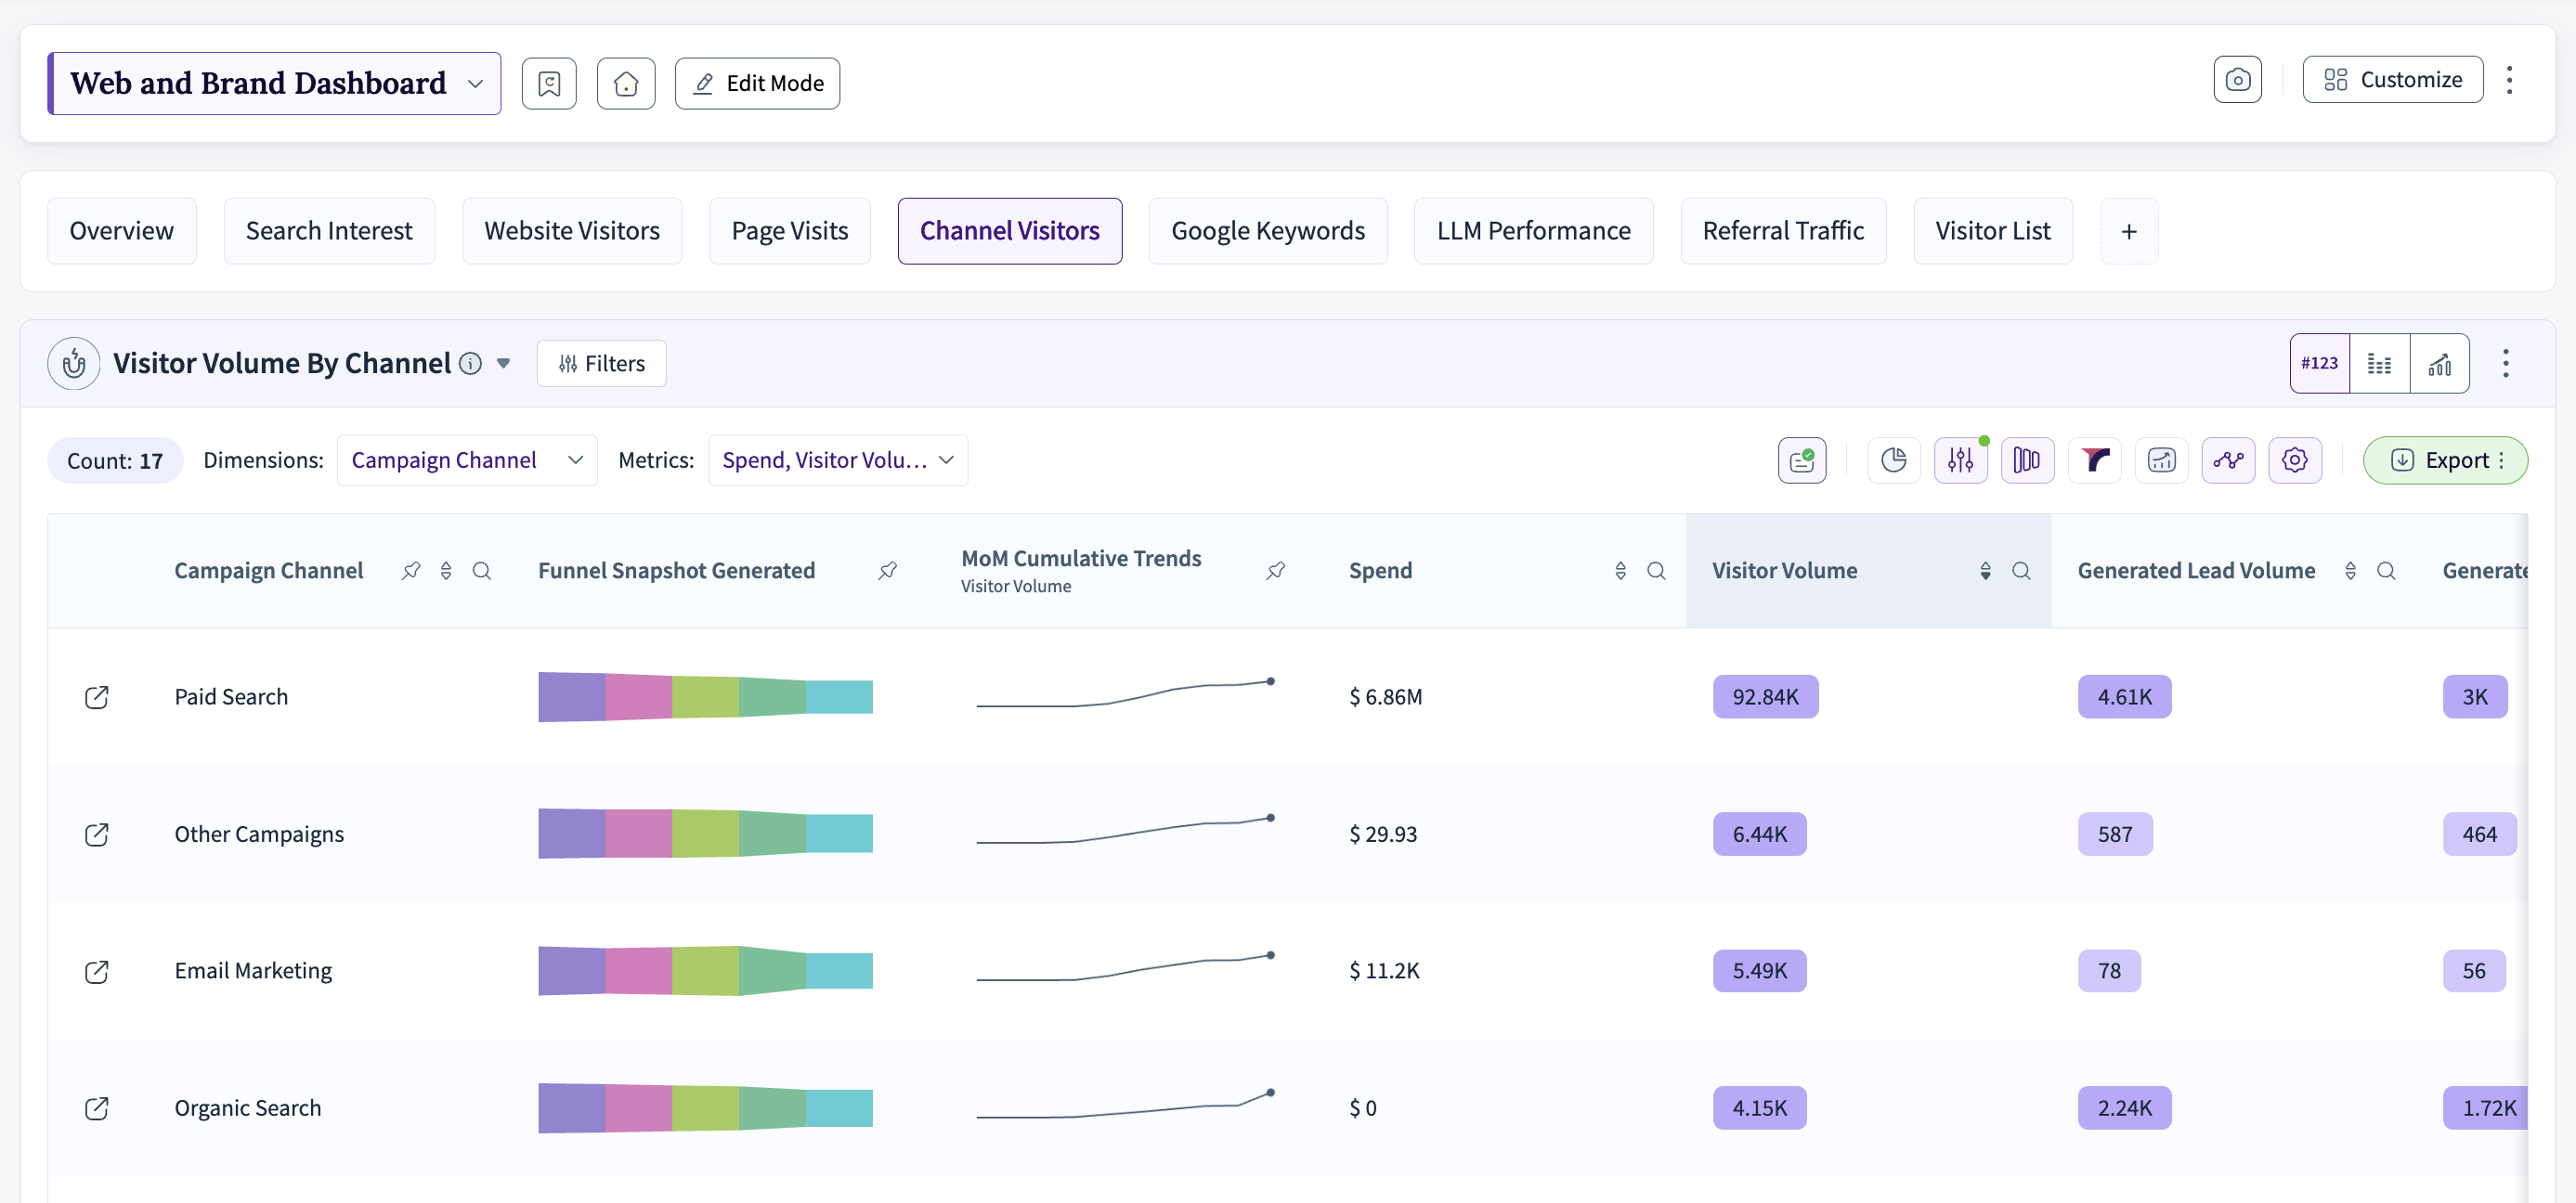
Channel Visitors Tab – Visitor Volume By Channel
Tab: Google Keywords
Purpose: Analyze performance of individual Google Ads keywords by visitor volume, lead generation, and match type. |
Widgets
Google Keywords
Dimensions: Campaign Member Keyword Text, Keyword Match Type (EXACT, PHRASE, BROAD).
Metrics: Visitor Volume, Generated Lead Volume, MQL/SQL Volume + MoM Cumulative Trends.
Useful Insight: "xxxxx" (EXACT) is the top keyword with 884 visitors and 560 leads indicating strong branded search intent. "software for tradesmen" (PHRASE) at 277 visitors reflects effective non-branded keyword performance.
Reference
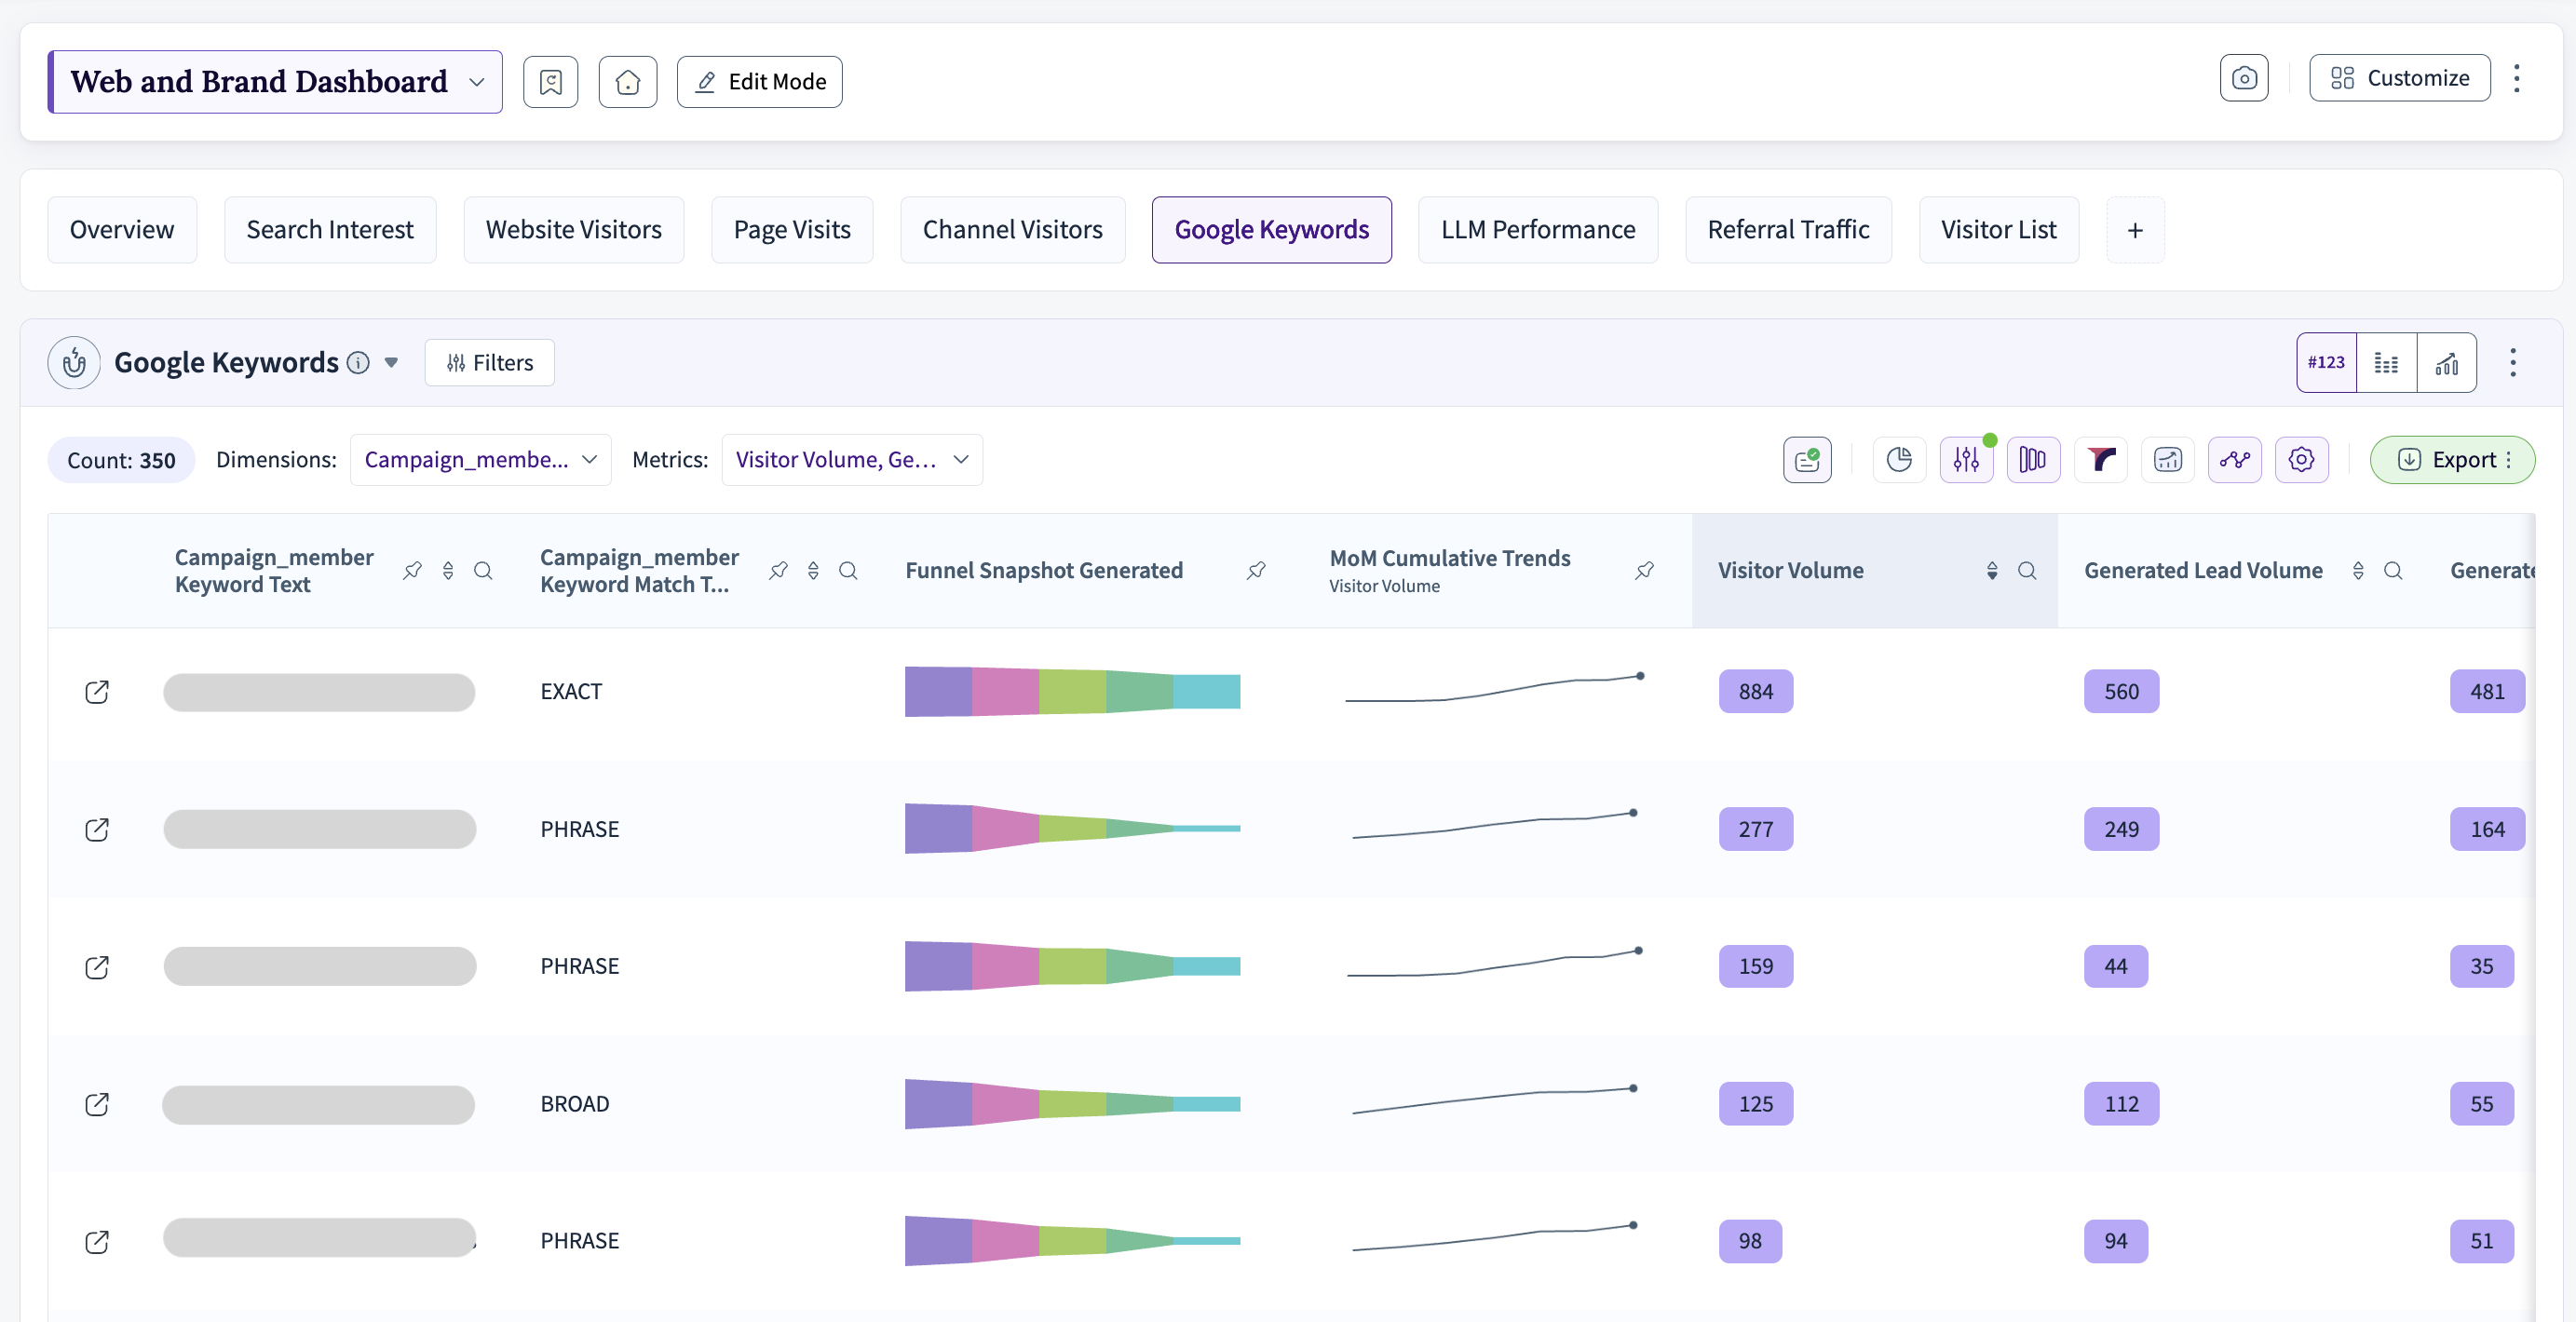
Google Keywords Tab
Tab: LLM Performance
Purpose: Track traffic and pipeline influence from AI-powered LLM platforms (e.g., ChatGPT, Gemini) as emerging referral channels. |
Widgets
LLM Campaigns
Metrics: Visitor Volume, Generated Lead Volume, MQL/SQL Volume, Pipeline Volume by LLM source (ChatGPT, Gemini, etc.).
Visualization: Funnel Snapshot Generated + MoM Cumulative Trends for Generated Pipeline Volume.
Useful Insight: ChatGPT.com leads with 25 visitors, 14 leads, and 13 SQLs indicating that AI referral traffic, while early-stage, is generating qualified pipeline. Tracking LLM channels helps teams measure and grow brand presence in AI-driven search environments.
Reference
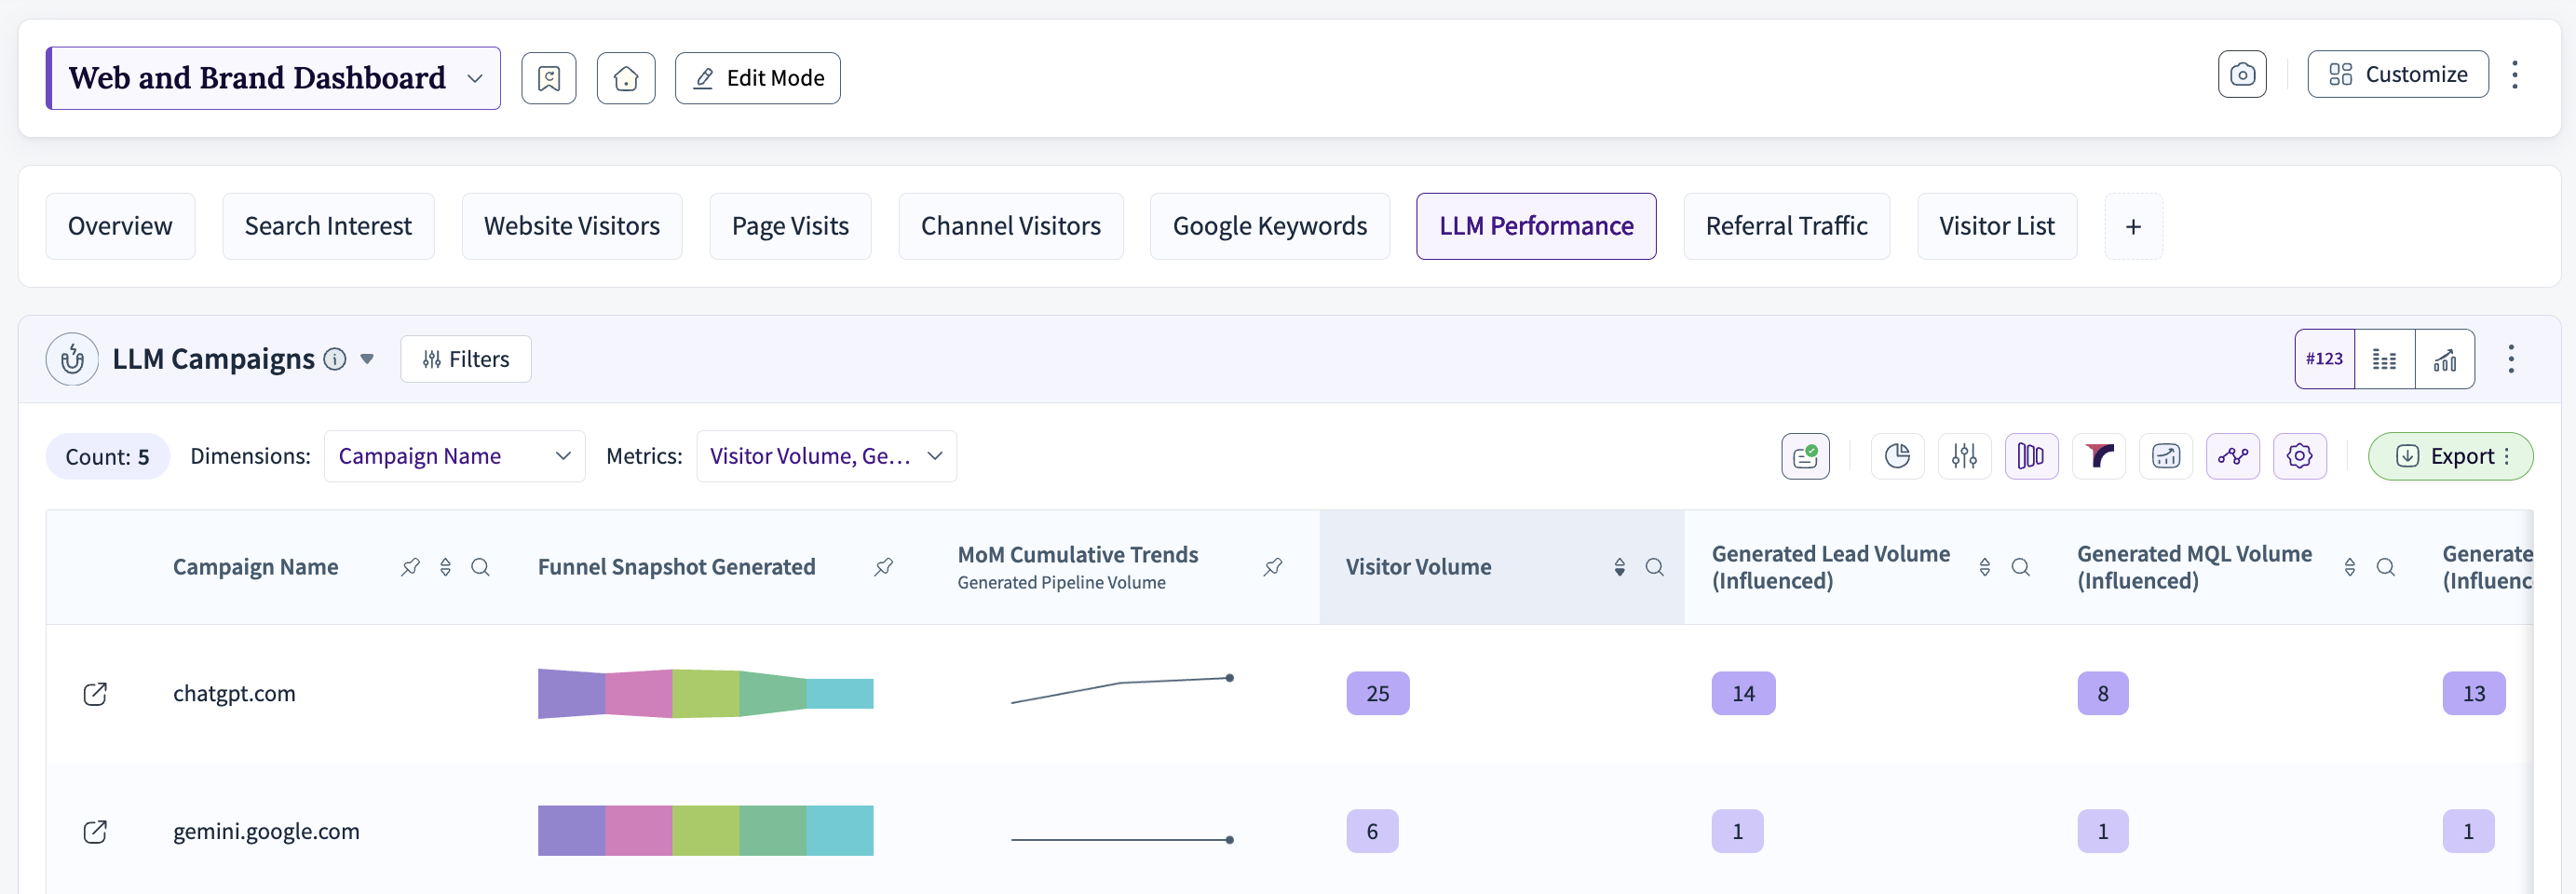
LLM Performance Tab – LLM Campaigns
Tab: Referral Traffic
Purpose: Attribute pipeline and funnel impact to specific referral sources to understand which external sites drive the most qualified traffic. |
Widgets
Referral Source Influence
Dimensions: Campaign Name (referral source URL, e.g., google.com, Direct, storylane.io, bing.com).
Metrics: Visitor Volume, Generated Lead/MQL/SQL Volume (Influenced), Generated Pipeline Value (Influenced).
Useful Insight: Google.com is the top referral source (581 leads, $246.59K pipeline), while storylane.io drives 146 leads highlighting the value of interactive demo content as a referral channel. Bing.com contributes $94.97K pipeline despite lower traffic.
Reference
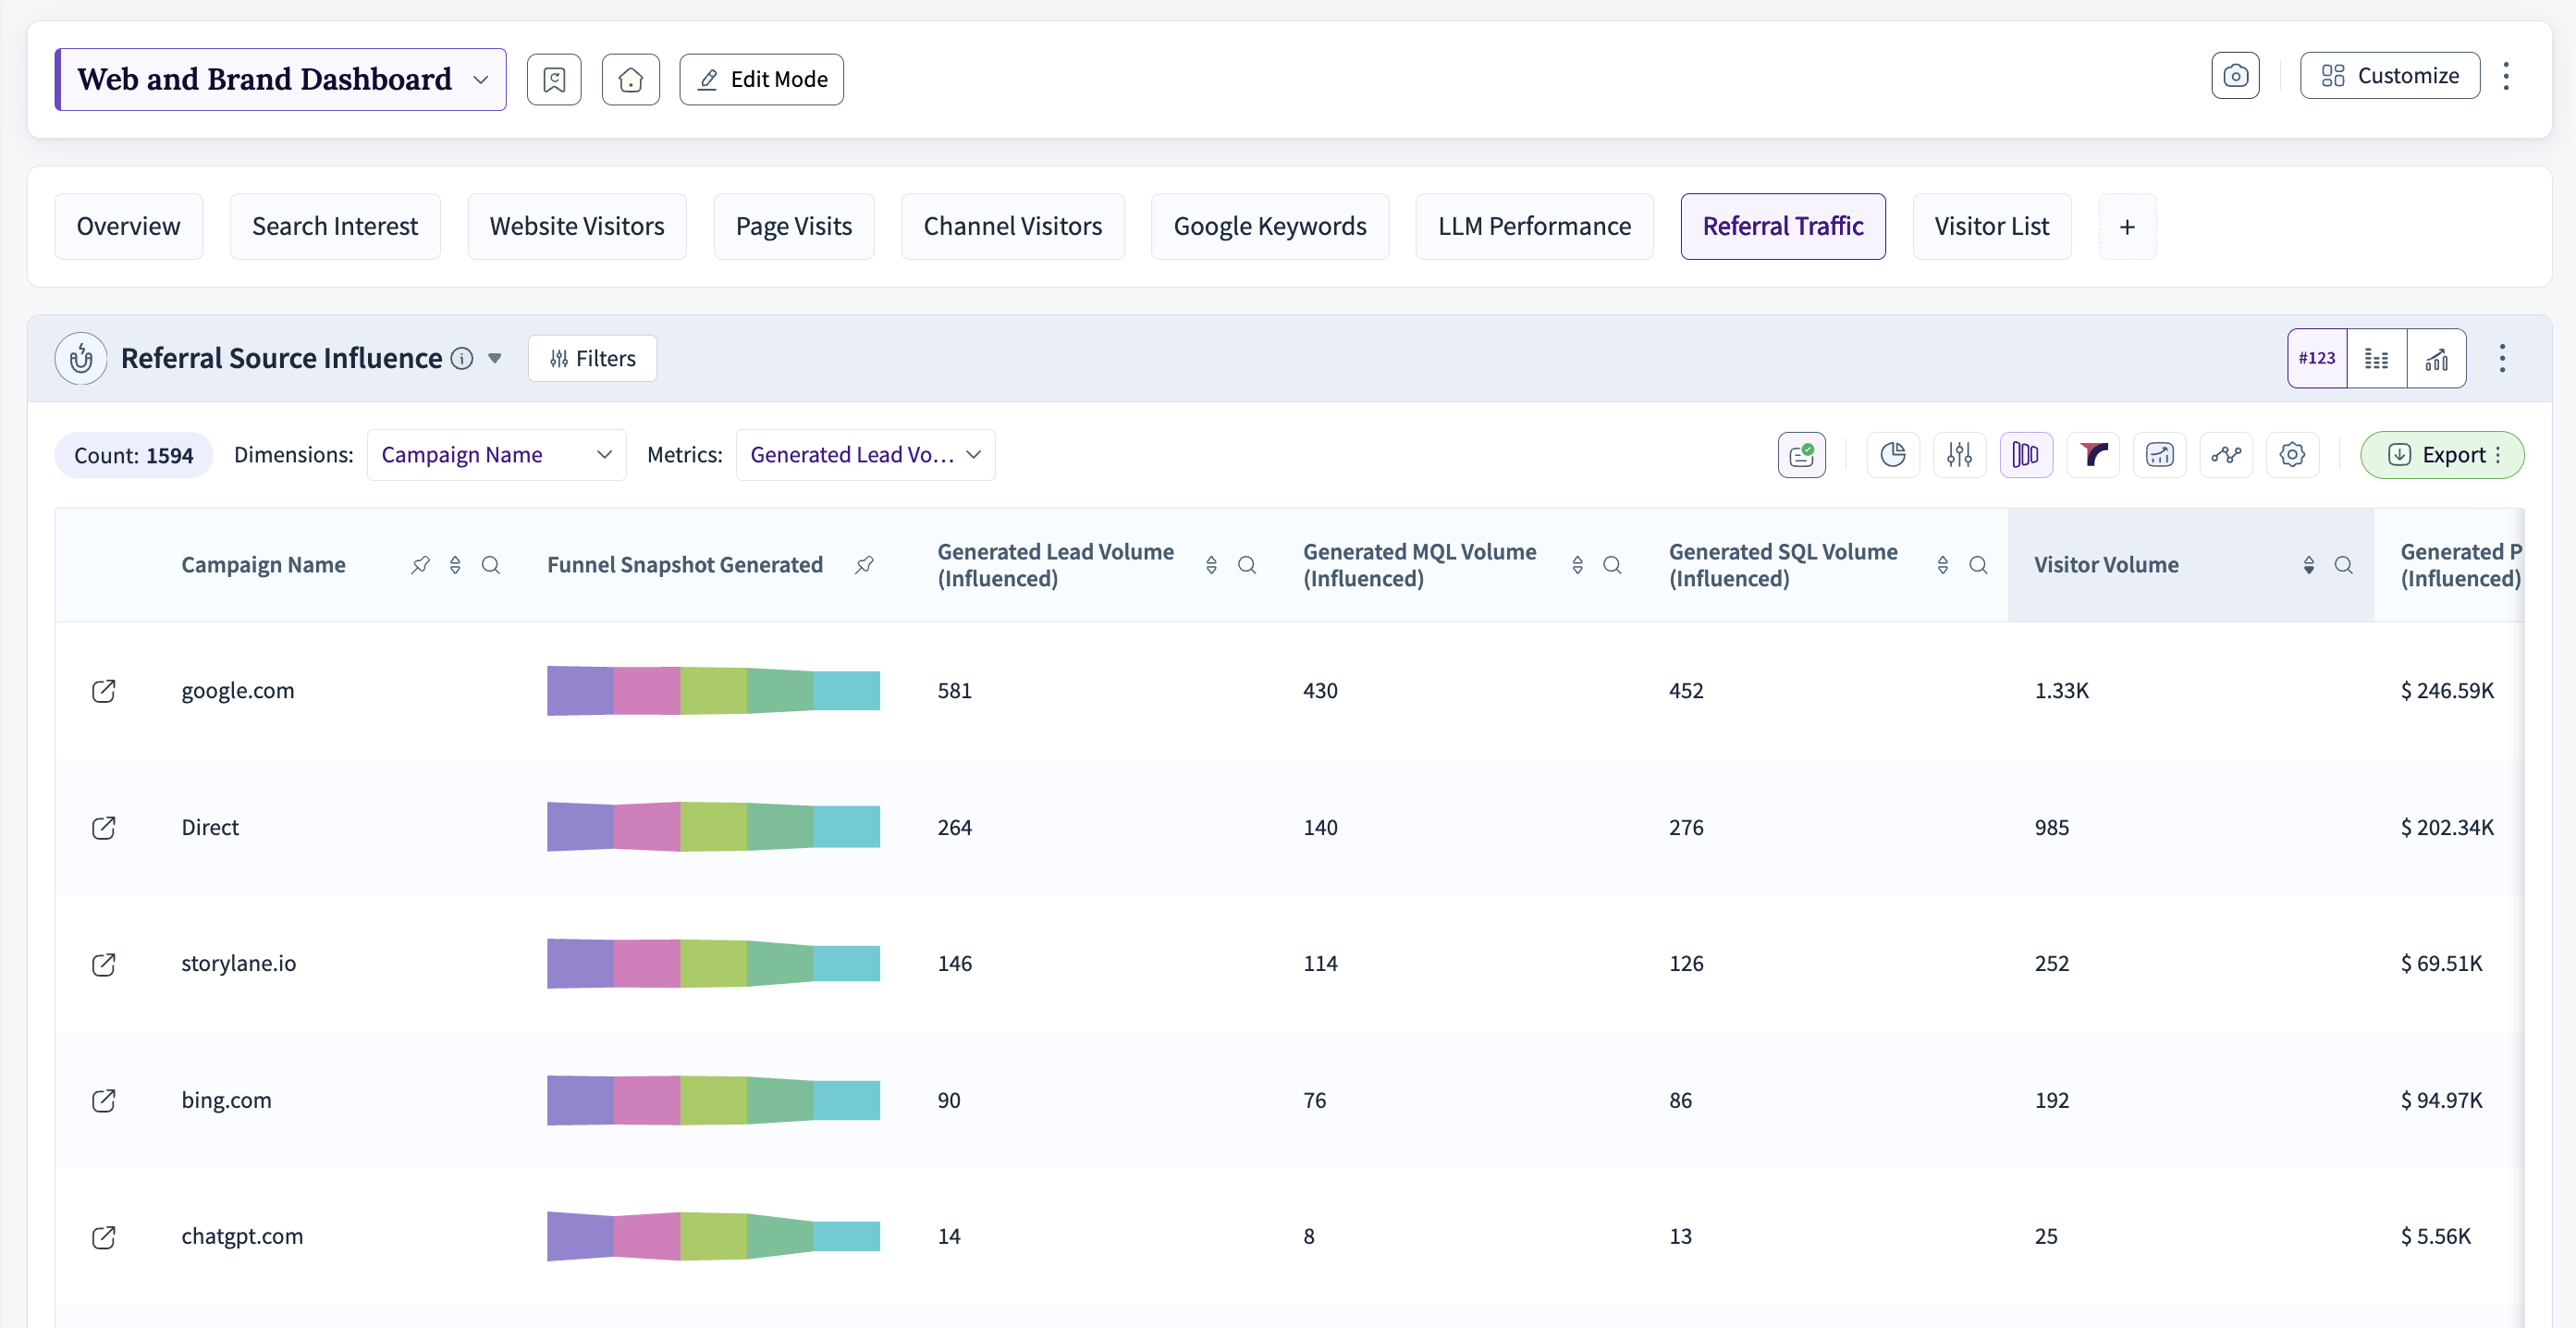
Referral Traffic Tab – Referral Source Influence
Tab: Visitor List
Purpose: Identify and explore individual website visitors, their associated accounts, journey timelines, and lead source categories. |
Widgets
Current Fiscal Year Visitors
Columns: Lead Name/ID, Account Name/ID, Journey Timeline, Duration, Age, Lead Source Category, First Touch.
Count: 4.05K visitors for the current fiscal year, filterable by funnel stage.
Useful Insight: Enables granular visitor-level analysis identifying accounts from known companies (e.g., Schneider Electric, Evercore) visiting the site, correlating visit duration and age with lead source to prioritize follow-up and retargeting efforts.
Reference
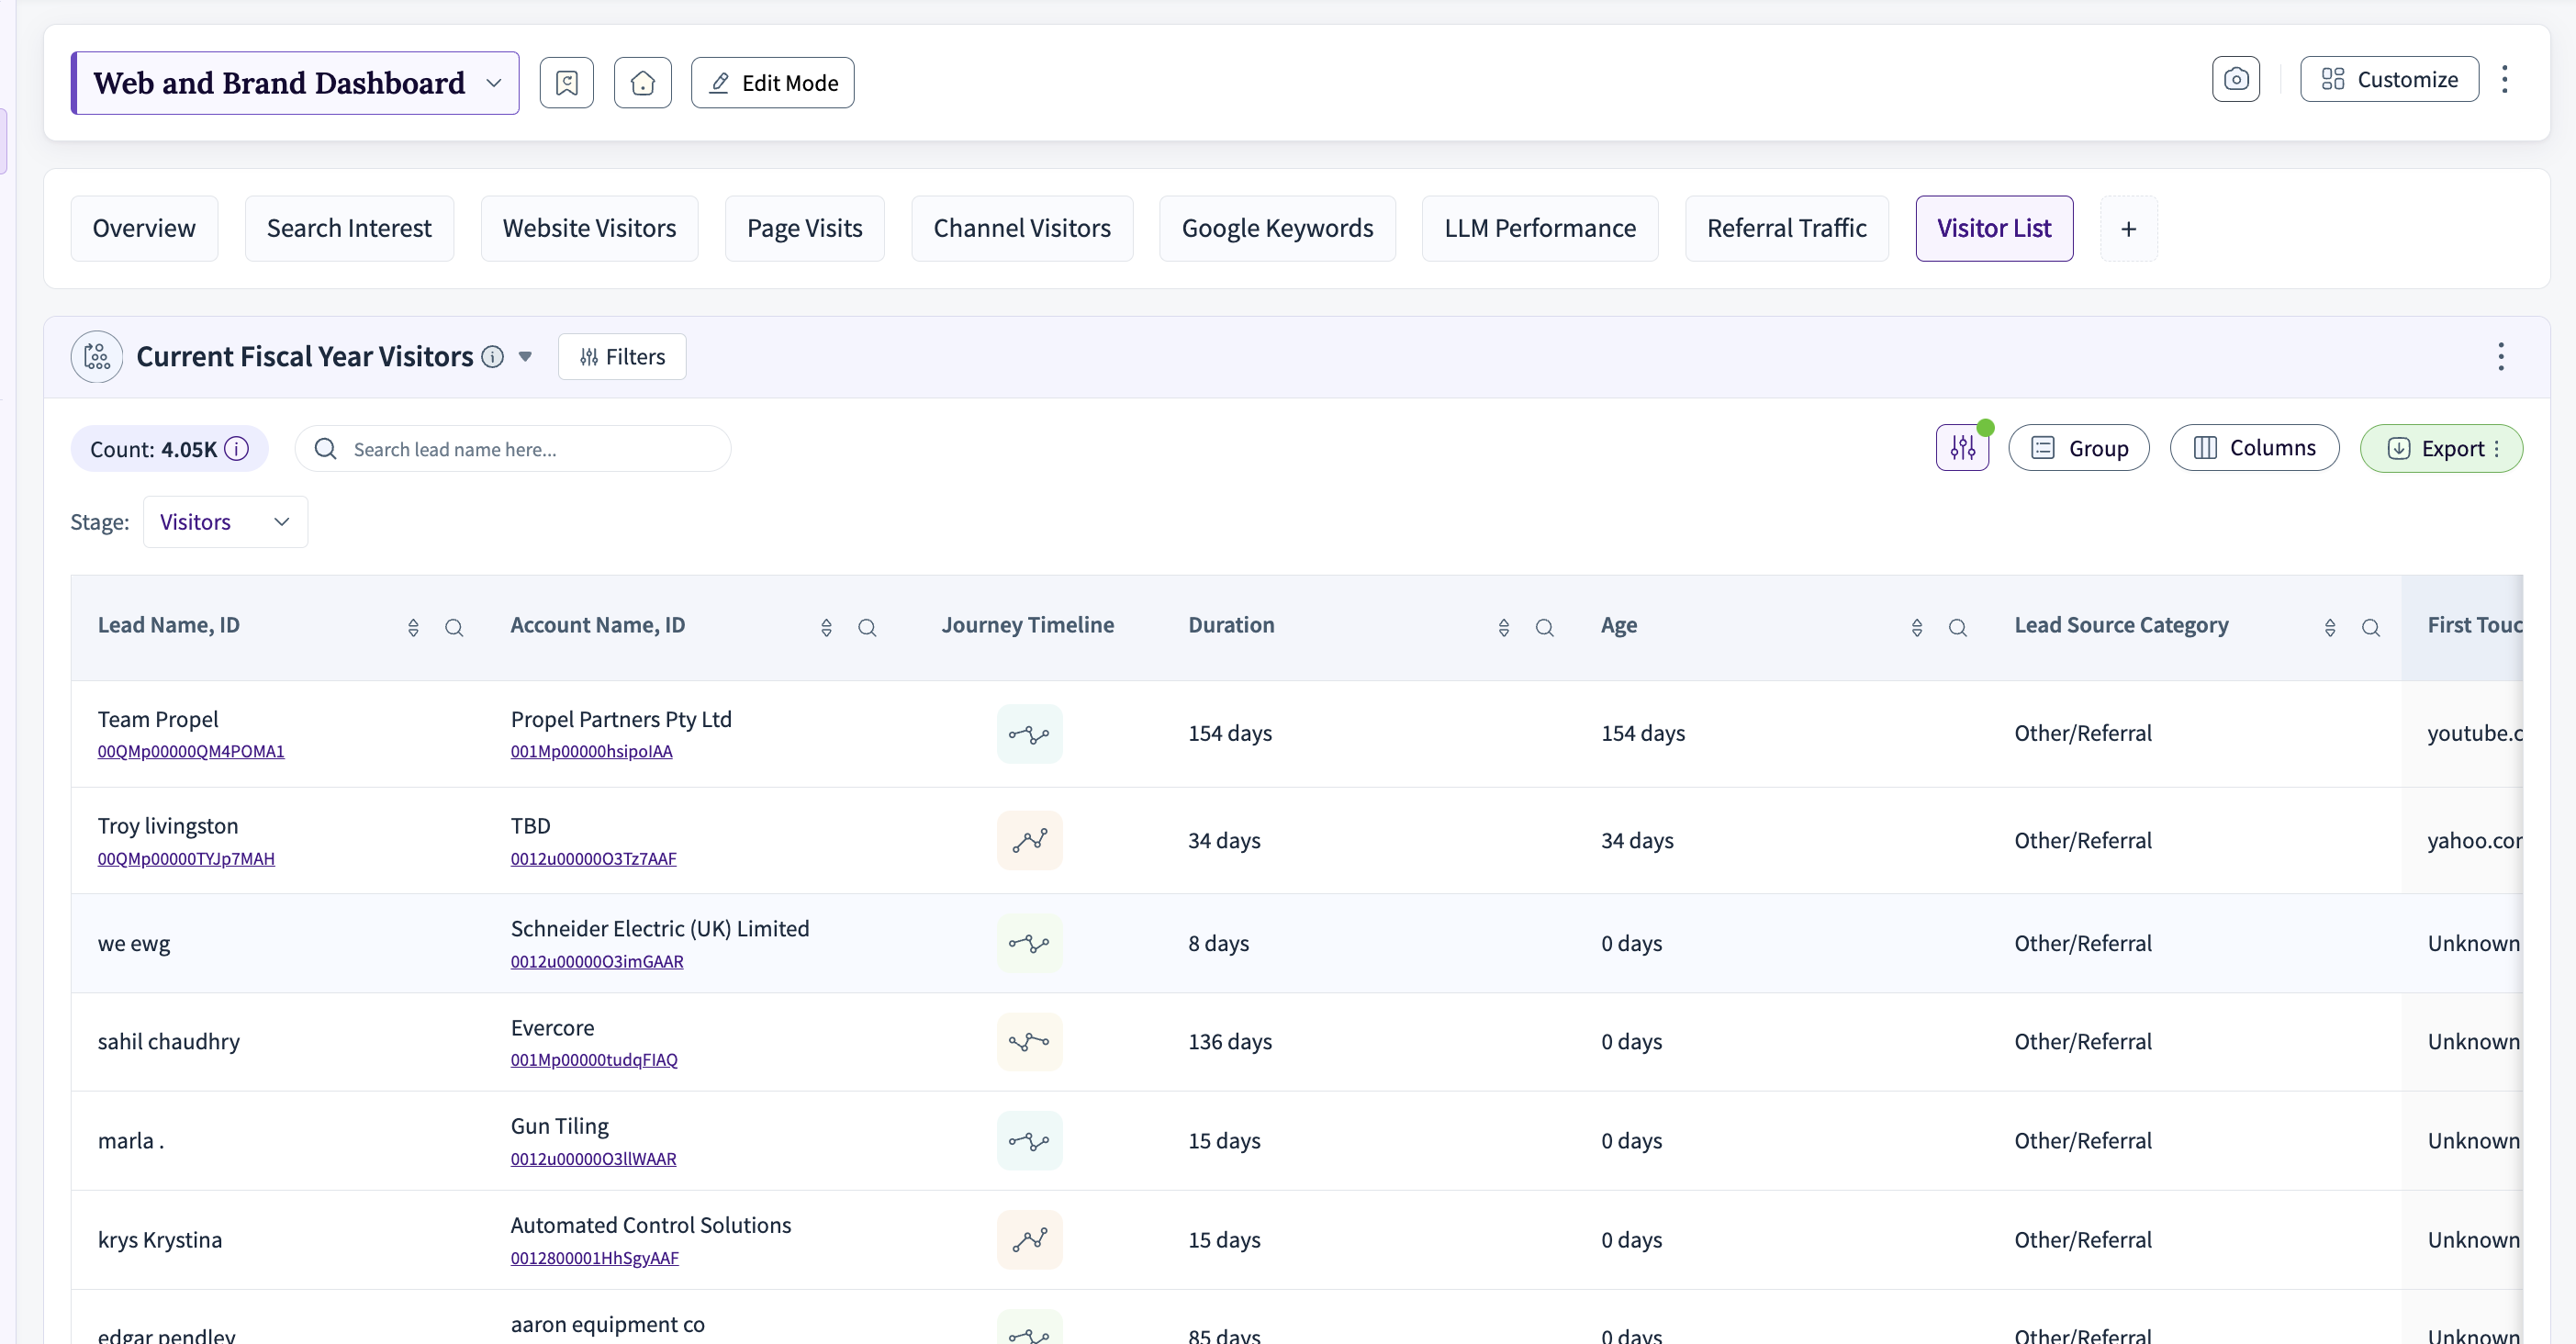
Visitor List Tab – Current Fiscal Year Visitors