The Spend Optimization widget helps you allocate and optimize marketing budgets across channels to maximize business outcomes such as pipeline value, lead volume, or ROI. It enables you to configure spend rules, select objectives, and compare performance against previous quarters.
1. Accessing Spend Optimization
To access the widget, you can go to Marketing Performance module > Marketing Mix Group > Spend Optimization
Similarly you can access it from the Marketing Mix Module
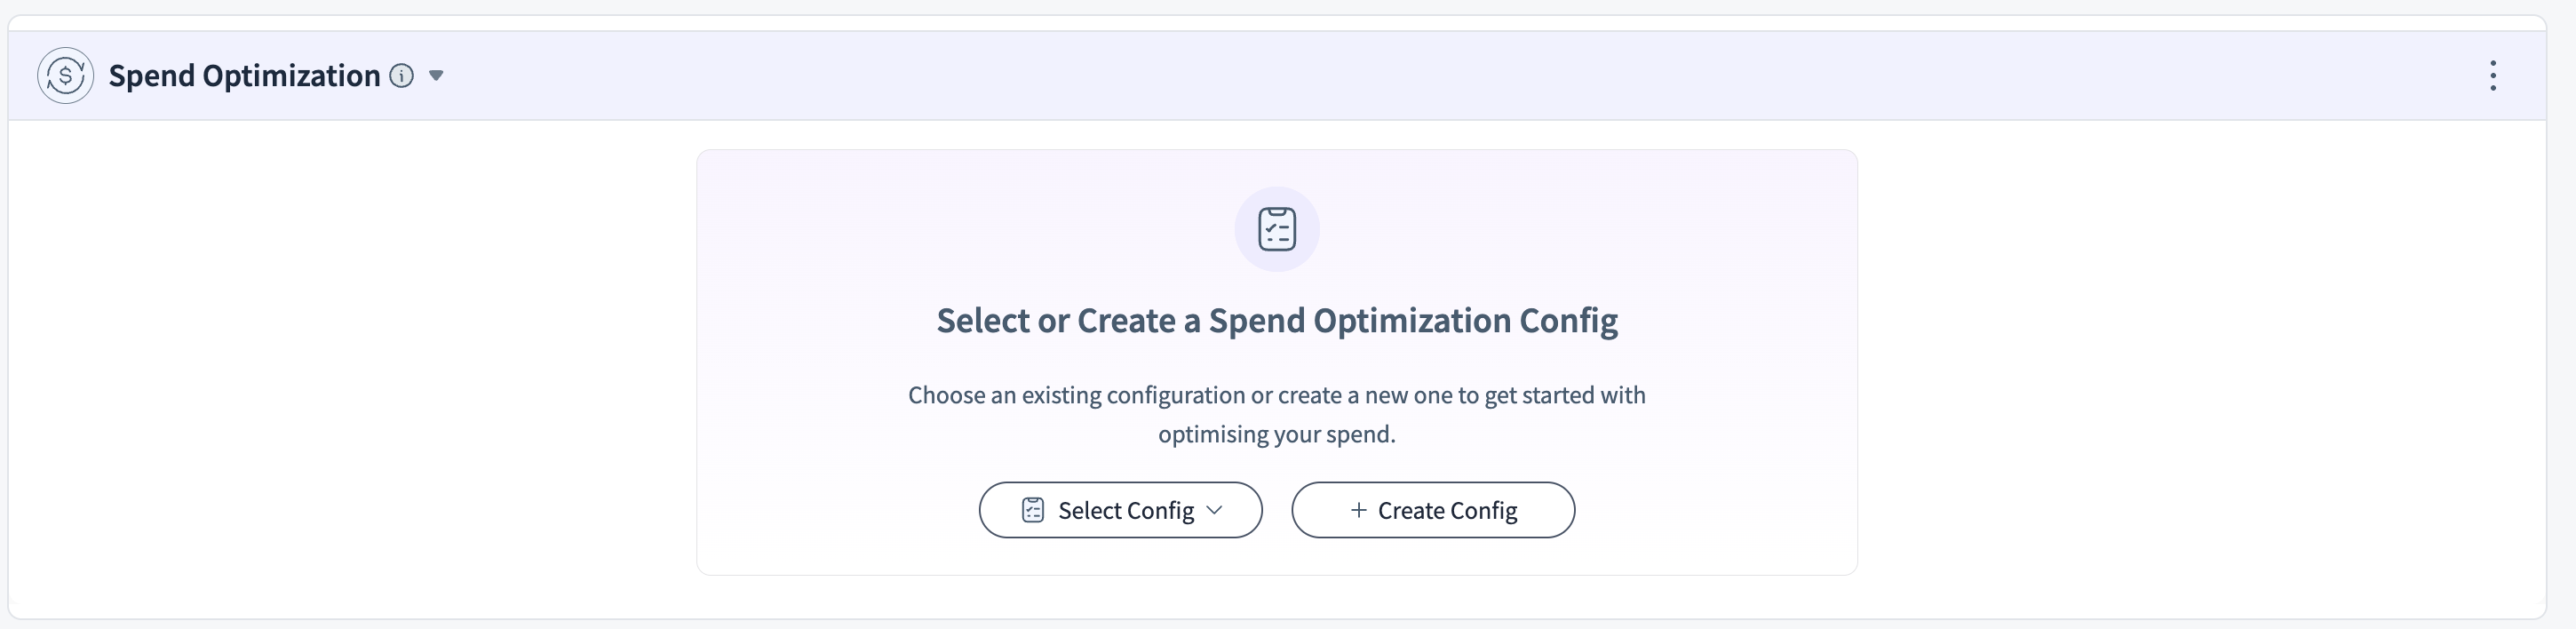
Select Config: Use an existing configuration.
Create Config: Build a new optimization setup from scratch.
2. Creating a Spend Optimization Configuration
Click + Create Config to set up a new configuration. You’ll be prompted to define:
a. Name
Give your configuration a unique, descriptive name.
b. Region
Choose the geographical region(s) the spend applies to (e.g., All Regions or specific markets).
c. Objective
Select the optimization goal. Options include:
Maximize Pending Marketing Qualification Volume (or ROI)
Maximize MCI Volume (or ROI)
Maximize Marketing Qualified Lead Volume (or ROI)
Maximize SAL Pursuing Volume (or ROI)
This ensures the budget allocation is aligned with your strategic priorities.
d. Marketing Channels
Pick the marketing channels (e.g., Google, LinkedIn, Facebook, Bing, Twitter) to include in optimization.
e. Forecast Duration
Full Quarter – Applies to the entire quarter.
Rest of the Quarter – Optimizes the reallocation for the remanining budget
f. Budgeting Spends
Two ways to input budget:
Enter Spend Manually – Specify a Total Budget and optionally set Min/Max Spend per channel.
Use Previous Quarter’s Spend – Automatically imports last quarter’s spend as a baseline.
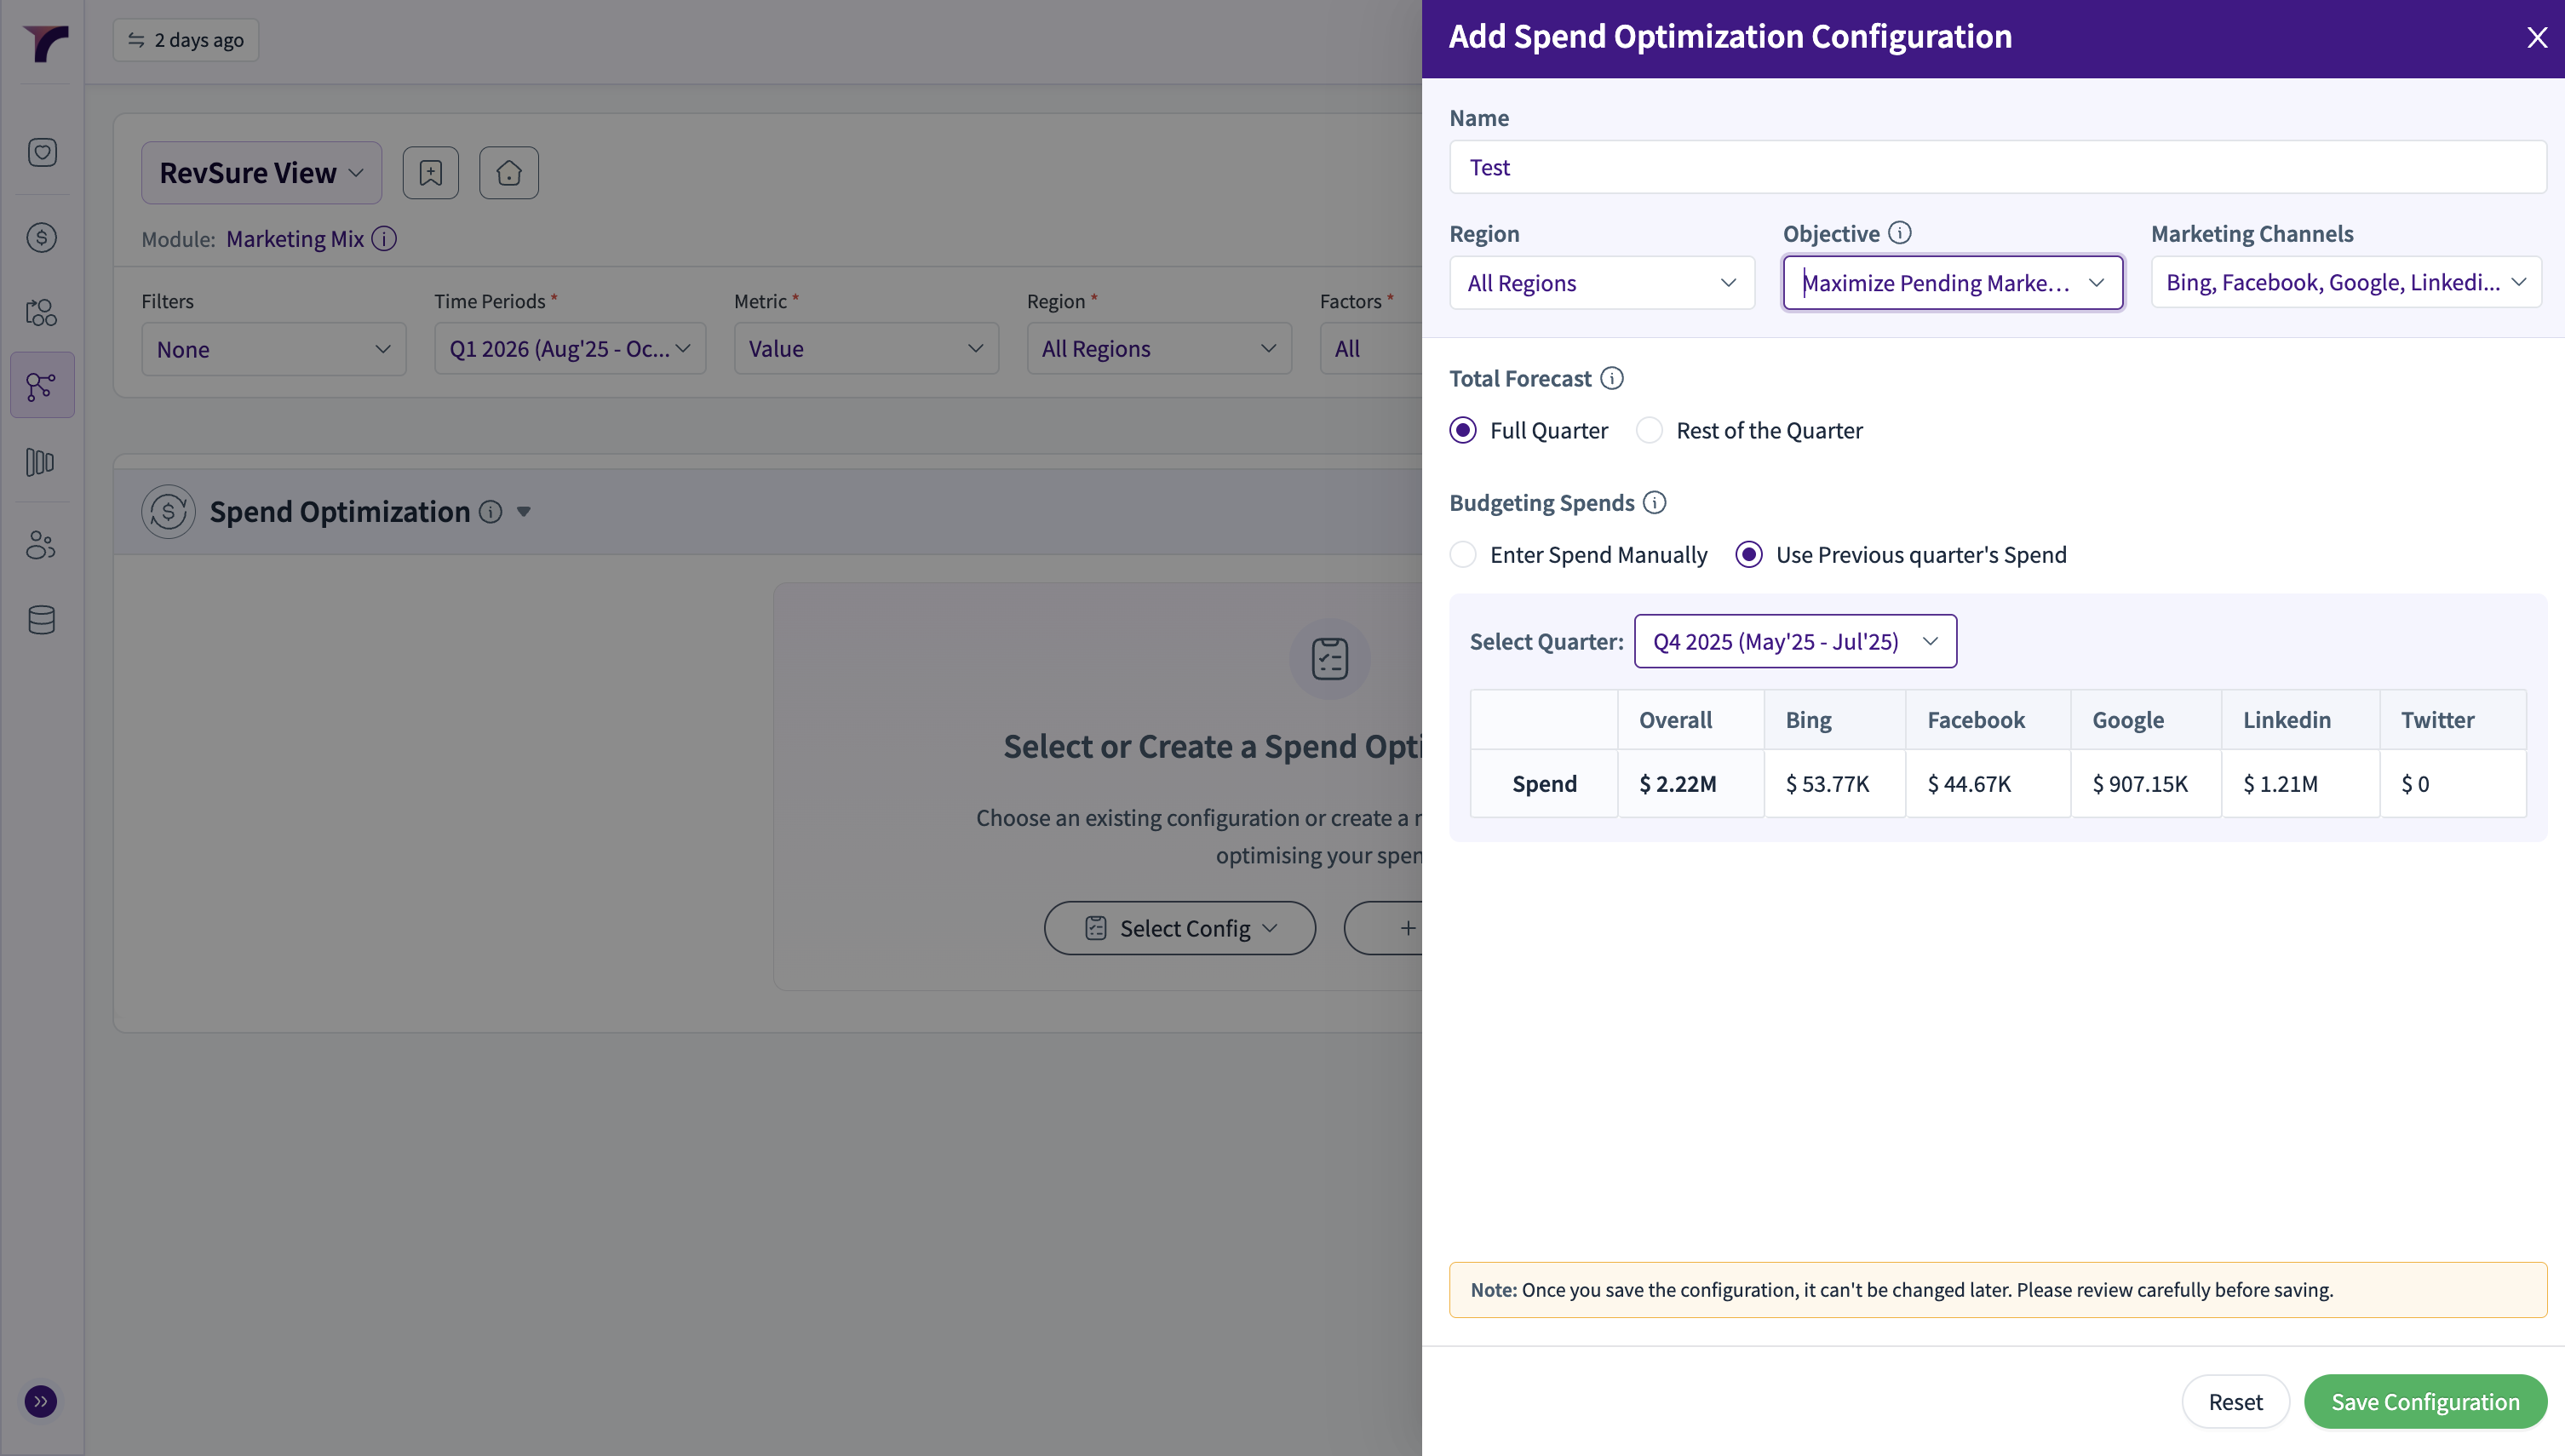
⚠️ Note: Once saved, configurations cannot be changed. Review carefully before saving.
3. Reviewing Optimal Spend Results
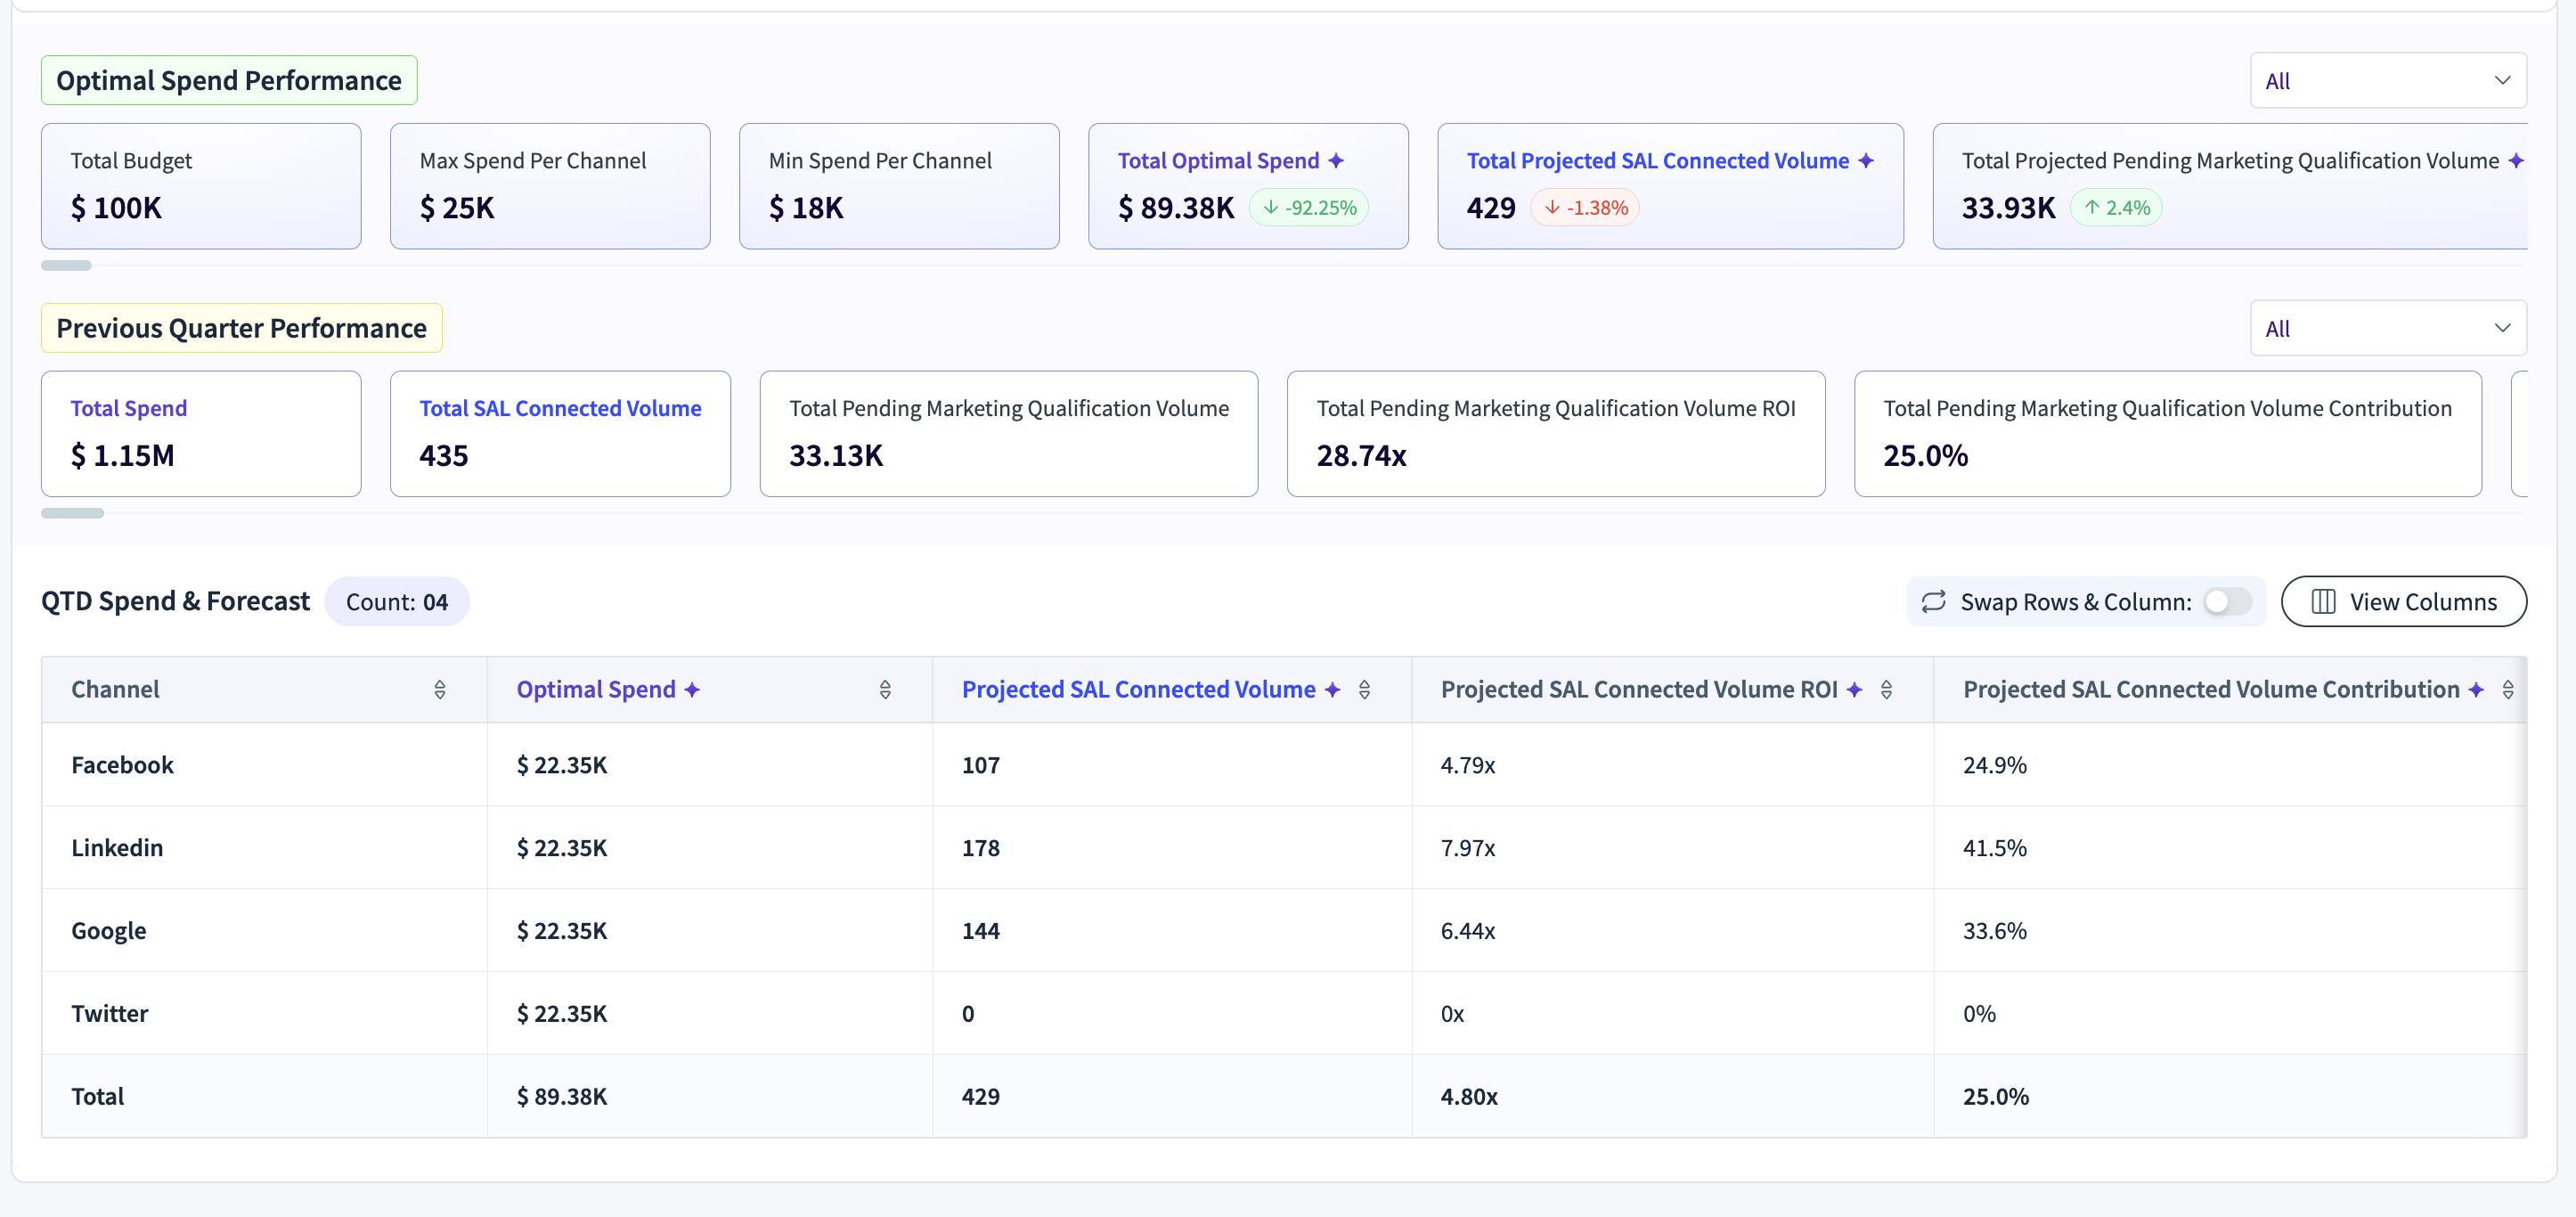
Once a configuration is saved, the widget calculates Optimal Spend Performance and displays it alongside Previous Quarter Performance for comparison.
Key Metrics Displayed
Total Budget – Budget entered or imported.
Total Optimal Spend – Suggested distribution across channels.
Total Projected Pipeline Value – Expected pipeline outcome.
Total Projected Pending MQ Volume & ROI – Predicted qualification outcomes.
Contribution by Channel – Each channel’s spend, pipeline value, ROI, and qualification volumes.
4. Example Insights from Output
In the Optimal Spend Performance view:
You can see whether the suggested spend is higher or lower than the previous quarter.
Each channel shows:
Spend Change (%)
Pipeline Value & ROI change
Volume Contribution
For example:
Facebook shows a 20% increase in spend leading to a +2.2% pipeline value increase, but ROI dropped compared to last quarter.
Bing’s spend rose by 22%, pipeline value increased slightly (+3.1%), but ROI fell.
This helps you make trade-off decisions between absolute growth and efficiency (ROI).
5. Best Practices
Always align the Objective with your current business goals (pipeline growth vs efficiency).
Use Min/Max Spend per Channel to avoid over-dependence on a single channel.
Compare Optimal vs Previous Quarter results to understand the performance impact of reallocations.
Start with "Use Previous Quarter’s Spend" as a baseline, then fine-tune manually if needed.
With this widget, marketers can simulate, configure, and compare spend allocations confidently—ensuring every dollar is optimized for measurable impact.