This page describes all the filters and options that are available to you on the Snapshot Funnel page. These filters and options work together to help you analyze how the leads and opportunities enter, move, and leak from the funnel.
.png)
Filters
This filter allows the user to choose the dimensions related to leads, accounts, and opportunities as filters. This is based on various dimensions that are configured.
You can add the desired dimensions to this filter by clicking the three-dot menu on the top-right of the page and selecting the ‘Edit Page’ option. Then add the dimensions you want in the ‘Filters’ section of the ‘Edit Page’. When you go back to the main page, the selected dimension and its options will now appear in the ‘Filter’ dropdown.
.png)
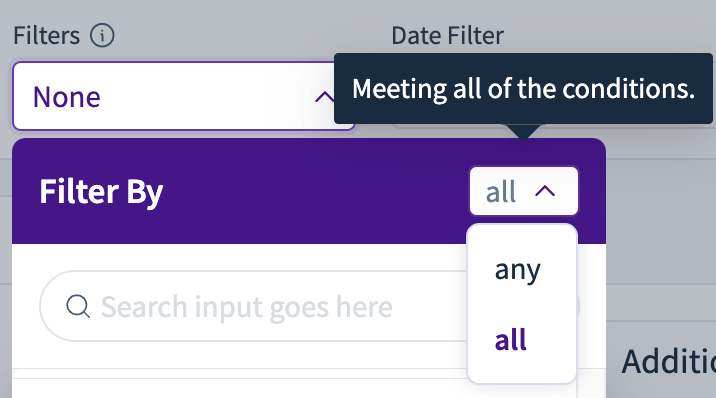
‘Any’ or ‘All’
The ‘Any’ option acts as an OR logic (union) for the selected options. The ‘All’ options act as an AND logic (intersection) for all the selected options.
Custom Filter
This allows you to create your own set of filtering rules based on the dimensions, operator, and value.
.png)
Date Filter
This lets you choose the date type on which the period filter will apply. The rest of the page will reflect the numbers based on this selection. The options are:
Funnel Stage Created At: The ‘Period’ filter will be based on the timestamp of when the lead/opportunity was created in the RevSure funnel. When you select this option, the ‘Consider Only First Movement’ dropdown becomes active (explained in the respective section below).
Source Created At: The ‘Period’ filter will be based on the timestamp of when the lead/opportunity was created in the source system.
Activity Period: The ‘Period’ filter will be based on the timestamp of the latest activity of the lead/opportunity in the RevSure funnel.
None [All]: No date type filter is applied.
.png)
Period
This is the period within which a lead/opportunity should have been created, and the timestamps used for this are based on the date type from the ‘Date Filter’ above. Using this option, we look at the leads/opportunities that have a created date that falls in the date range selected by the user.
.png)
View Trends
This option allows you to choose the time granularity for a trend line that appears below every stage of the funnel. The trend line is made up of the data points for the period selected from the ‘Period’ filter. The two bigger dots on the trend line are for the current and the previous quarter/month/week.
Also, in the ‘Funnel’ tab, the trends are based on sliding window logic. So at each data point on the trend line, we reduce the start and end date by the selected ‘View Trend’ option (by quarter/month/week).
If you don’t want to view the trends, please select the ‘None’ option.
.png)
Metric
This is a list of metrics you can choose from and view every stage of the funnel in terms of the selected metric. The chart below the funnel stages also reflects the same metric.
.png)
Consider Only the First Movement
Sometimes, the leads and opportunities may move backwards in the funnel or may leak and come back to the funnel after some time. This will cause them to go through some part of the funnel multiple times.
In case you want to only consider the first time a lead/opportunity progressed forward in a funnel, select ‘True’.
In case you want to consider all the times a lead/opportunity progressed through the funnel, select ‘False’.
.png)