Ask. Analyze. Create. Share.
RevSure Canvas is a conversational analytics workspace that makes it easier to explore your RevSure data, answer GTM questions, create interactive dashboards, and share insights across your organization.
Instead of navigating through multiple reports to find an answer, you can start with a business question in natural language. RevSure Canvas uses RevSure's connected GTM data and intelligence to analyze the question and return an answer, an interactive artifact, or both.
With RevSure Canvas, the workflow becomes:
Ask → Analyze → Create → Refresh → Share
What You Can Do with RevSure Canvas
1. Ask Questions in Natural Language
Start with the business question you want to answer.
You do not need to know which report, metric, or dataset to open. RevSure Canvas interprets your request and uses the relevant RevSure data tools to perform the analysis.
Example questions
How is our GTM performance this quarter compared with last quarter?
What are the biggest pipeline risks?
Which campaigns are generating the most pipeline?
Which channels have the strongest conversion rates?
Where are leads leaking from the funnel?
Which accounts are showing the strongest engagement?
What is driving pipeline growth?
Which marketing activities have the highest incremental impact?
How does performance differ by segment, region, or account cohort?
You can start with a broad question and continue drilling into the results through follow-up questions.

2. Continue the Analysis Through Conversation
RevSure Canvas supports multi-step analysis within the same conversation.
For example:
Start with:
Show me our pipeline performance for this quarter.
Then continue with:
Which segments are driving the decline?
Break this down by channel.
Which campaigns contributed the most?
Show me the accounts behind that change.
This allows you to move naturally from what happened → why it happened → where to take action without starting a new analysis every time.

3. Powered by RevSure Data and MCP Tools
RevSure Canvas is connected directly to RevSure MCP tools.
Depending on your question, RevSure Canvas can use one or multiple RevSure tools to retrieve and analyze the appropriate GTM data.
This allows RevSure Canvas to work with RevSure's existing intelligence across areas such as:
Pipeline and bookings
Funnel performance
Campaign performance
Marketing attribution
Account and lead engagement
Customer journeys
Conversion analysis
Incremental lift
Pipeline leakage
Spend and ROI
Cohort and segment analysis
GTM signals and opportunities
The result is conversational access to the same trusted RevSure data used across your RevSure environment.
Artifacts and Interactive Dashboards
4. Turn an Analysis into an Artifact
Any useful analysis can be transformed into an interactive artifact.
An artifact is a reusable dashboard or analytical view generated from your conversation.
For example, after asking:
Analyze paid media performance and identify which channels are contributing the most incremental pipeline.
You can ask:
Create an artifact from this analysis.
RevSure Canvas can turn the analysis into a structured dashboard containing relevant:
KPIs
Charts
Tables
Trends
Comparisons
Segmentation
Analytical summaries
This enables you to go directly from:
Question → Analysis → Dashboard
without manually rebuilding the analysis in another BI tool.

5. Update Existing Artifacts Through Chat
Your artifact does not have to remain static.
Continue the conversation and ask RevSure Canvas to modify the artifact.
For example:
Add a breakdown by customer segment.
Add pipeline conversion rate.
Compare this quarter with last quarter.
Add a table showing the top 20 campaigns.
Remove the spend chart.
This makes dashboard creation an iterative, conversational process.
Refreshable Analytics
6. Refresh an Artifact On Demand
Artifacts can be refreshed using the latest available RevSure data.
Instead of recreating the dashboard every time the underlying data changes, simply refresh the artifact.
The dashboard is regenerated using the latest data while retaining the analytical use case it was created for.
This is especially useful for recurring views such as:
Weekly pipeline reviews
Marketing performance reviews
Campaign reporting
Funnel health monitoring
Executive GTM reviews
Monthly business reviews
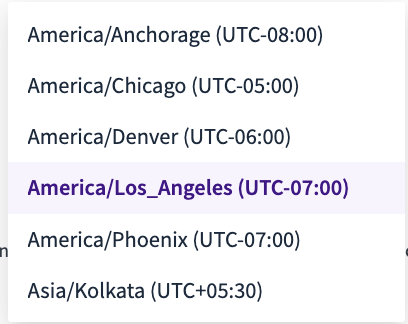
7. Schedule Automatic Refreshes
Artifacts can also be configured to refresh automatically on a schedule.
This allows frequently used dashboards to stay current without requiring users to manually recreate or rerun the analysis.
For example, a team could maintain a:
Weekly Pipeline Performance Dashboard
that automatically refreshes using the latest RevSure data before the weekly pipeline review.
This gives AI-generated artifacts an important capability traditionally associated with BI dashboards: persistent analytics that stays current as the underlying data changes.

8. Refresh Notifications
When a scheduled artifact refresh completes, users can receive a notification with a link to the refreshed artifact.
This makes it easier to incorporate RevSure Canvas into recurring operating workflows and ensure teams are always reviewing the latest information.
Sharing and Collaboration
9. Save Your Artifacts
Artifacts created through RevSure Canvas are saved in the Artifacts section.
You can return to them later without having to recreate the original analysis.
This creates a reusable library of analytical outputs for your organization.
10. Private and Public Artifacts
Artifacts can be kept private or shared with other authorized RevSure users.
Private
The artifact remains available only to the user with appropriate access.
Public
The artifact becomes discoverable by other authorized users within the RevSure environment.
This allows useful analyses created by one user to become reusable resources for a broader team.
11. Share Artifacts Using a Link
Artifacts can also be shared directly using their artifact link.
This makes it easy to include RevSure analysis in:
Slack conversations
Emails
Pipeline reviews
Marketing meetings
Business reviews
Executive discussions
Instead of sending screenshots or exporting static reports, teams can access the latest available artifact directly.
Access continues to follow the permissions configured for the artifact and RevSure environment.
Chat History
12. Access Previous Conversations
RevSure Canvas maintains your previous chats so that you can return to earlier analyses.
This is useful when you want to:
Continue an investigation
Review how an insight was generated
Ask additional follow-up questions
Create an artifact from an earlier analysis
Revisit a recurring business question
Your analytical work does not disappear when the conversation ends.
Artifact Library
13. Access Previously Created Artifacts
The Artifacts section provides a central place to access dashboards created through RevSure Canvas.
Users can quickly move between conversational analysis and previously generated dashboards.
This helps organizations build a reusable collection of analyses for common GTM questions.

Model Selection
14. Choose the AI Model
RevSure Canvas supports model selection, allowing users to choose from available AI models for their conversation.
Regardless of the selected model, RevSure Canvas continues to use RevSure's MCP tools and authorized RevSure data to perform the underlying GTM analysis.
This gives users flexibility in how they interact with RevSure while keeping RevSure data and analytical capabilities at the center of the experience.
Common Use Cases
Executive GTM Performance
Ask:
Give me an executive summary of our GTM performance this quarter versus last quarter. Highlight the biggest positive signals, pipeline risks, and areas requiring attention.
Use the output for executive and leadership reviews.
Pipeline Analysis
Ask:
Analyze pipeline creation this quarter. Show trends by region, segment, and channel and identify where performance has changed significantly.
Create an artifact and refresh it before each pipeline review.
Marketing Performance
Ask:
Which campaigns and channels generated the most pipeline and bookings over the last 90 days?
Continue with:
Compare efficiency using spend and pipeline ROI.
Turn the final analysis into a marketing performance dashboard.
Funnel Conversion
Ask:
Show conversion through the funnel from Inquiry to MQL to Pipeline and identify the biggest leakage points.
Continue with:
Break the leakage down by segment and campaign type.
Incremental Lift
Ask:
Measure the incremental lift associated with our major campaign types for progression from Inquiry to Pipeline.
Use the analysis to understand whether exposure to particular marketing activities is associated with improved conversion beyond simple attribution.
Account Analysis
Ask:
Which accounts have shown the largest increase in engagement during the last 30 days?
Continue with:
Show their recent campaigns, activities, and pipeline status.
This can help sales and marketing teams prioritize accounts requiring attention.
Cohort Analysis
Ask:
Compare pipeline conversion across Enterprise, Mid-Market, and SMB accounts.
Continue with:
Show which campaigns and channels perform best within each cohort.
Why RevSure Canvas?
Traditional analytics often requires users to know:
Which dashboard to open
Which filters to apply
Which metrics to compare
How different datasets relate to each other
General-purpose AI assistants can make analysis conversational, but they typically do not provide persistent GTM dashboards that remain connected to your RevSure environment and can be refreshed as your data changes.
RevSure Canvas combines both experiences.
Conversational Analytics
Ask business questions using natural language.
RevSure Intelligence
Analyze connected GTM data through RevSure MCP tools.
Interactive Artifacts
Turn analysis into reusable dashboards.
Refreshable Outputs
Refresh dashboards on demand or automatically on a schedule.
Collaboration
Save, share, and reuse analytics across your team.
The result is a simpler way to move from:
Business Question → Trusted Data → Insight → Dashboard → Decision
Best Practices
For the best RevSure Canvas experience, provide enough context for the analysis you want.
Instead of:
Show campaign performance.
Try:
Compare campaign performance for the current quarter versus last quarter using generated pipeline, bookings, spend, and pipeline ROI. Break the results down by campaign type and highlight the largest changes.
Useful information to include where relevant:
Time period
Funnel stage
Metric
Segment
Region
Campaign or channel
Comparison period
Desired breakdown
Business outcome
You can always start broadly and refine the question through follow-up prompts.
A Typical RevSure Canvas Workflow
1. Ask
How is our GTM performance this quarter?
2. Analyze
Review the KPIs, trends, risks, and opportunities identified by RevSure Canvas.
3. Investigate
Why has pipeline decreased?
Which segments contributed the most?
Which campaigns are involved?
4. Create
Create an artifact from this analysis.
5. Refine
Add conversion rate and a segment breakdown.
6. Refresh
Refresh the artifact whenever you need the latest RevSure data.
7. Automate
Configure a scheduled refresh for recurring reporting.
8. Share
Make the artifact available to other authorized users or share its link.
RevSure Canvas at a Glance
Capability | What It Enables |
|---|---|
Conversational Q&A | Ask GTM questions using natural language |
Follow-up Analysis | Drill from high-level performance into underlying drivers |
RevSure MCP Integration | Analyze trusted RevSure GTM data |
Artifact Creation | Convert conversations into interactive dashboards |
Artifact Editing | Modify dashboards conversationally |
On-Demand Refresh | Update artifacts with the latest data |
Scheduled Refresh | Automatically keep recurring dashboards current |
Refresh Notifications | Receive updates when refreshed data is available |
Chat History | Return to and continue previous analyses |
Artifact Library | Access reusable dashboards in one place |
Private/Public Sharing | Control artifact visibility |
Link Sharing | Share analytical outputs directly with other authorized users |
Model Selection | Choose from supported AI models |
Getting Started

Open RevSure Canvas, start a new chat, and ask your first GTM question.
A good starting prompt is:
Analyze our GTM performance for the current quarter. Highlight the strongest positive signals, the top pipeline risks, and the areas that require attention. Then recommend the most useful follow-up analyses.
From there, continue the conversation, turn useful analyses into artifacts, keep them refreshed, and share them with your team.
RevSure Canvas: Ask. Analyze. Create. Share.
RevSure Canvas requires a RevSure Canvas subscription. Available features, AI models, permissions, and data access may depend on your organization's RevSure configuration.