The Pipeline Readiness module helps you understand how much pipeline you have generated for a particular quarter and whether you will have enough going into a quarter to achieve your booking targets. Pipeline Readiness shows you the projection range for the next 4 quarters by default. This can be increased to 8 quarters or reduced to 2 or 3 quarters in the Projections and Insights Configuration Section.
You can choose the pipeline to be viewed by either value, which represents the pipeline value or volume, which represents the count of pipeline items or opportunities. You can also split or dice your pipeline by any of your dimensions, either standard or custom - such as Marketing vs Sales, Region, New vs Upsell, Inbound vs Outbound. To configure a custom dimension, use the Dimensions Configuration module.
Pipeline Readiness Metrics can be found here.
Filters
.png)
Apply filters for any data that you would like to filter in. There are multiple filters available:
Filter (based on data dimensions): This helps you filter the data based on data dimensions such as existing customer accounts, industry, country, lead source, etc.
Metric: Use this filter to view the data on the page in terms of volume or dollar value.
View Trends: Use this to select the granularity of the data that you are viewing. You can view the data on a weekly basis or on a monthly basis. The 'None' option chooses the default option configured for you.
Metrics Cards
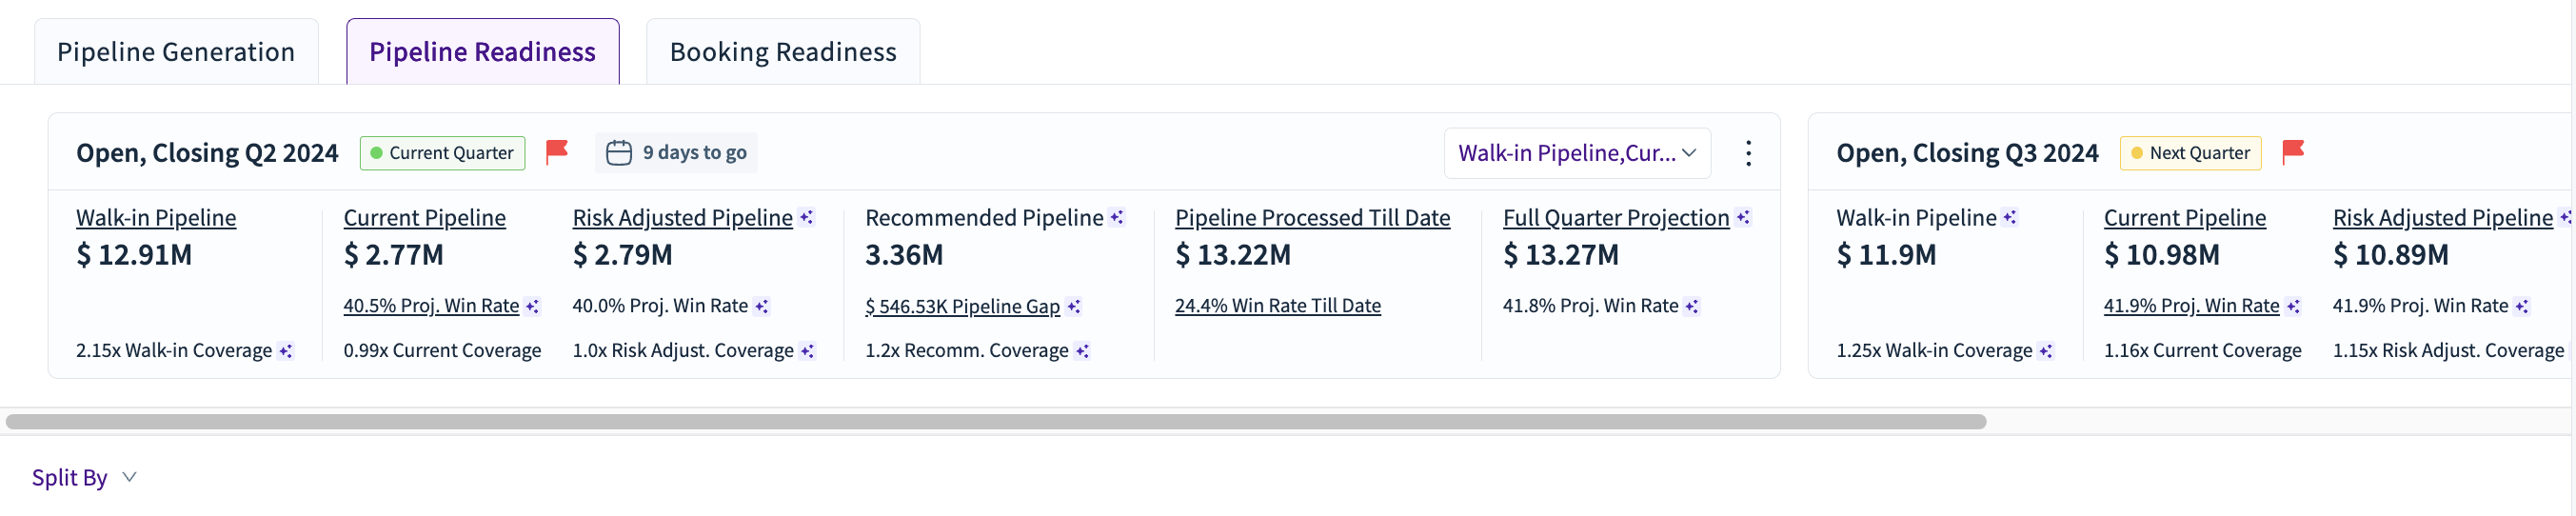
The metrics cards show various metrics for the current and next quarter. These are related to the pipeline opportunities that are expected to close either in the current quarter or the next quarter.
The flag icon indicates whether we will hit or miss the booking target for the quarter. The metrics displayed in each card can be selected from the dropdown menu at the top-right side of the card. The three-dot menu helps you navigate to a particular tab in the side panel and drill down further. At the bottom, there is a ‘Split By’ dropdown that helps you look at the details table (below the metrics cards) with a focus on a particular data dimension (e.g., Account Type, Opportunity Type, etc.).
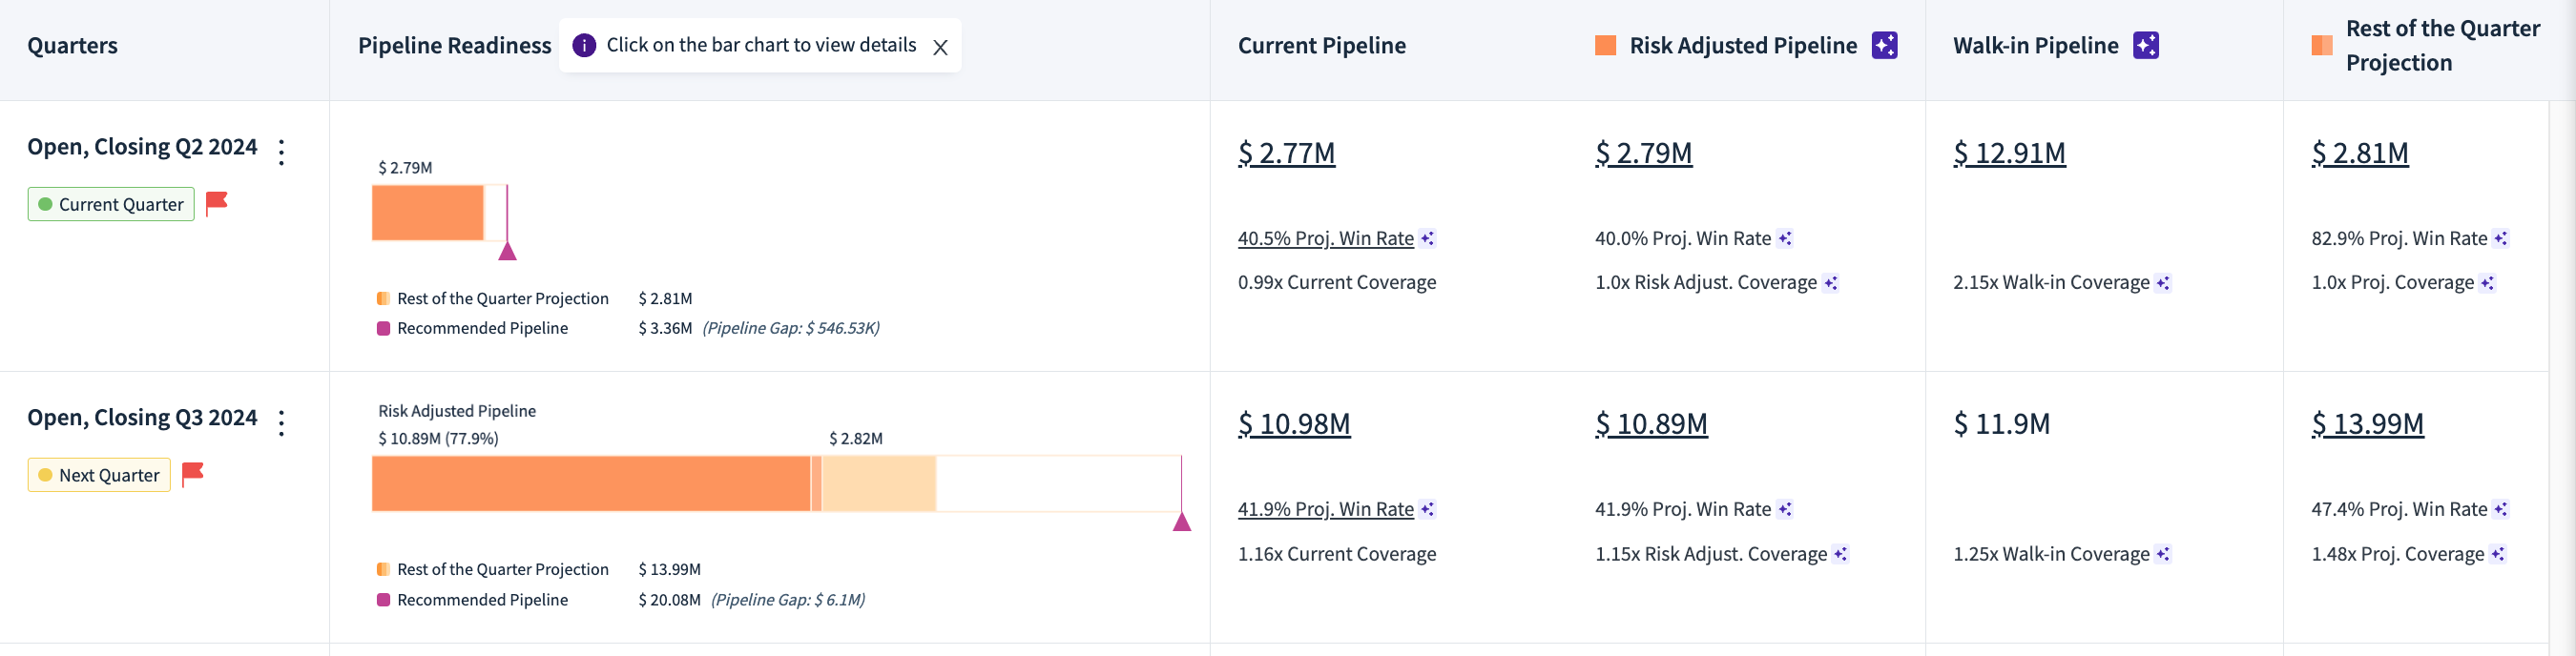
Metrics
You can see the trends and metrics of these pipeline values by value and volume, and correlate them with the win rates of the pipeline based on the quality of the pipeline to understand if the value or volume of the pipeline is directly or indirectly affecting the quality of the pipeline.
Walk-in Pipeline: This refers to the amount of the pipeline we enter the quarter with. Clicking on this will open the associated tab in the side panel. For future quarters, this value is projected, which is how much Pipeline you will enter the quarter with.
Current Pipeline: This is the current pipeline for all opportunities where the closing date is that quarter.
.png)
Projected Win Rate: This is RevSure’s model-generated win rate for the current pipeline. You can click on it to see the composition and the factors contributing (positively/negatively) to the win rate.
Risk-Adjusted Pipeline: During a quarter, some opportunities may get “pushed" to be closed in subsequent quarters, or opportunities that were supposed to close in a future quarter earlier may close in the current quarter (“pull”). Hence, the ‘Risk-Adjusted Pipeline’ is calculated as follows:
Risk-Adjusted Pipeline = Current Pipeline + Projected Pipeline Pull - Projected Pipeline Push
.png)
By clicking on ‘Proj. Pipeline Pull’ or ‘Proj Pipeline Push’ links, a pop-up opens to show from which quarters the pull or push is expected.
Recommended Pipeline: This is the recommended pipeline by RevSure’s models that you need, along with the win rate projections, to be able to meet your booking target for this quarter.
Pipeline Gap: If the Recommended pipeline > Projections, then Pipeline Gap is the difference between Recommended and Projections. Otherwise, it is zero
Pipeline Processed Till Date: This is a culmination of the current pipeline (‘Open’), ‘Closed Won’, and ‘Closed Lost’. Clicking on this will open the associated tab in the side panel.
Win Rate Till Date: This is the win rate from the start of the quarter till the current day, based on the pipeline generated for the quarter and bookings so far.
Full Quarter Projection: This is the pipeline projection for the complete quarter based on the current/today’s date. It is calculated as follows:
Full Quarter Projection: Proj. Pipeline Pull - Proj. Pipeline Push + Projection from Funnel + Demand Gen. Potential + Pipeline Processed Till Date
.png)
Side-Panel
.png)
The side panel gives access to the summary metrics and also helps you drill down into the details. It can be accessed from multiple points (links) on the main page. The side panel consists of various tabs.
Most of the tables in the side panel provide various metrics for each opportunity for their respective tabs. You can select the columns you wish to view for each opportunity/row. You can also export the data as a CSV file.
Side Panel Tabs
Walk-in Pipeline: This gives the details about the quarter’s walk-in pipeline. The table also provides various metrics for each opportunity.
Processed Till Date: This gives the details about opportunities that have been processed till the current date for this quarter as a table.
Composition: This allows you to view the composition based on the data dimensions. You can also overlay it with various metrics calculated by RevSure. It also contains a table that can be used for drill-downs and can be exported.
Breakdown: This tab provides the details about the pipeline stage breakdown. The upper table has various stages as columns. The lower table provides details for every opportunity.
Projections: This tab provides more details about various projections for various stages. The table provides SQL/SQA details for every opportunity.
Movements: This tab captures how the pipeline movements have happened at every stage of the pipeline. It can be viewed in terms of ‘Value’ or in terms of ‘Volume’.
.png)
The tabs below the chart contain the opportunity-wise data and metrics for every stage.
Recommendations: This tab provides the details of various recommendations from the RevSure model for leads and opportunities moving from one stage to another..png)