Introduction
Marketing performance is your whiteboard, a build-from-scratch Dashboarding module that supports a variety of capabilities. The Marketing Performance module has a collection of widgets that help you analyse your marketing efforts and their outcomes. There are multiple types/sections, each with its respective collection of widgets:
Marketing Performance
Funnel Health
BI (Business Intelligence) Reporting & Dashboarding
Prioritization and Recommendations
Pipeline Analytics
Pipeline Health
Incrementality Testing
Marketing Mix
The dashboarding capabilities include
Creating multiple tabs in a view
Selecting a widget from across various groups and rearranging them
Renaming the widget
Create a copy/clone of a widget
Copy or move a widget to another tab
Expanded view of a widget
Download the snapshot of the widget in PNG
Hiding a widget or a tab from the view
Deleting the widget
Note:
Please note that the original copy of a widget cannot be deleted. Only clones can be deleted. However, original copies can be hidden from view.
Please note that the original copy of a widget cannot be moved to a new tab. Only clones can be moved from a tab while not retaining them in the current tab. However, original copies can be cloned, and the clone can be moved to another tab using the ‘Copy & Move to another tab’ option.
Reli Assist & Summary
Against each widget, you will see a Reli Assist button that will give you a summary of the widget. The summary is an AI-generated TLDR, which gives you a quick overview and key takeaways of the data from the widget.
.png)
Marketing Performance
Marketing Performance Overview
This section gives an overview of the performance of various marketing efforts in terms of Pipeline generation, Volume and Value, Bookings, ROI, Projections, Leads, etc.
.png)
The ‘Filters’ button next to the section title allows you to filter and view the metrics. Below are the available filters:
Filters: Filter by ‘None’, ‘Campaign Type’, or ‘Campaign Name’.
Campaign date type: Choose between ‘Campaign Start Date’ or ‘Campaign Engagement Date’.
Lead/Opp created period: Specify the time frame for when leads or opportunities were created.
Opp Attribution: Select the attribution method for opportunities, such as ‘Primary Contact’, ‘All Contacts’, or ‘Account’.
Attribution model: Choose the model used to attribute marketing influence. There are multiple attribution models available
SFDC Attribution: Uses Salesforce data to attribute credit for conversions based on predefined rules and models within the Salesforce ecosystem.
First Touch Campaign: Attributes 100% of the credit for a conversion to the first interaction a customer has with your brand.
Last Touch Campaign: Assigns all the credit for a conversion to the final interaction before the conversion.
Any Touch Campaign: Distributes credit evenly across all interactions a customer had with your brand before conversion.
Linear: Allocates equal credit to each touchpoint in the customer journey, leading to a conversion.
W-Shape: Assigns higher credit to the first, middle, and last interactions, with remaining credit distributed equally among other touchpoints.
U-Shape: Gives the highest credit to the first and last interactions, with the remaining credit divided among the other touchpoints.
J-Shape: Attributes most of the credit to the first touchpoint and progressively less credit to subsequent touchpoints, with the last touchpoint receiving a significant amount of credit.
Inverse J-Shape: Opposite of the J-Shape, it assigns most of the credit to the last touchpoint and progressively less to earlier touchpoints, with the first touchpoint receiving a significant amount of credit.
AI Attribution by Campaign Name: Utilizes artificial intelligence to allocate credit for conversions based on specific campaign names and their performance.
AI Attribution by Campaign Type: Leverages artificial intelligence to distribute credit for conversions based on the type of campaigns and their effectiveness.
Advanced Controls: Access additional settings and filters to refine campaign data, such as Campaign Touches.
.png)
You can view all the ‘Key Metrics’ for the performance of your funnel and marketing efforts. The ‘Volume’ and ‘Value’ tabs will show the volume and revenue flowing through every stage of your funnel, respectively. Additionally, you can also use the ‘Contribution’ toggle to see the percentage contribution of some of the metrics.
The ‘Metrics’ button brings up a list of available metrics that you can select and view in this section. Below are all the available metrics for you:
Budget: The total amount allocated for marketing activities within a specified period.
Spend: The actual expenditure incurred on marketing campaigns and initiatives.
No of Campaigns: The total count of marketing campaigns executed.
No of Channels: The number of different channels utilized for marketing efforts.
Generated Lead Volume: The total number of leads generated from marketing activities.
Influenced Account Volume: The number of accounts impacted by marketing campaigns.
Generated Pipeline Volume: The volume of potential sales opportunities created by marketing.
Generated Booking Volume: The total number of confirmed sales or bookings resulting from marketing efforts.
Generated Pipeline Value: The monetary value of the sales pipeline attributed to marketing activities.
Generated Booking Value: The revenue generated from confirmed sales or bookings due to marketing.
Pipeline ROI: The return on investment calculated for the sales pipeline created by marketing.
Booking ROI: The return on investment calculated for confirmed sales or bookings from marketing efforts.
Gross Cost Per Lead: The total cost incurred to generate a single lead.
Generated Lead Volume: The aggregate count of leads generated through marketing efforts.
Generated MQL Volume: The number of Marketing Qualified Leads (MQLs) identified by marketing.
Generated Pre-SAL Volume: The volume of leads that are ready for Sales Accepted Leads (SAL) status.
Generated SAL Volume: The count of leads accepted by the sales team from marketing efforts.
Generated SQL (Pipeline) Volume: The number of Sales Qualified Leads (SQLs) generated from marketing.
Generated Closed Won Volume: The volume of sales opportunities that have been successfully closed and won.
Projected Pipeline ROI: The anticipated return on investment for the sales pipeline generated by marketing.
Projected Booking ROI: The expected return on investment for bookings resulting from marketing campaigns.
Total Leads Volume: The cumulative number of leads generated from all marketing activities.
Total Pipeline Volume: The total volume of potential sales opportunities in the pipeline.
Total Booking Volume: The overall number of confirmed sales or bookings from marketing efforts.
Total Leads Value: The total monetary value attributed to the leads generated.
Total Pipeline Value: The aggregate value of all sales opportunities in the marketing pipeline.
Total Booking Value: The combined revenue from all confirmed sales or bookings generated by marketing.
Marketing Trends
.png)
This chart (or table, based on the toggle) allows you to compare the trends of two metrics over a period of time. There are 2 Y-axes, and you can select the metric to be assigned to each of these axes from the drop-down. You can also select the time granularity to view the trends as ‘Weekly’, ‘Monthly’, or ‘Quarterly’.
The metrics available for the 2 Y axes are:
Budget
Spend
No of Campaign
No of Channel
Generated Lead Volume
Influenced Account Volume
Generated Pipeline Volume
Generated Booking Volume
Generated Pipeline Value
Generated Booking Value
Pipeline ROI
Booking ROI
Gross Cost Per Lead
Generated Lead Volume
Generated MQL Volume
Generated Pre-SAL Volume
Generated SAL Volume
Generated SQL (Pipeline) Volume
Generated Closed Won Volume
Projected Pipeline ROI
Projected Booking ROI
Total Leads Volume
Total Pipeline Volume
Total Booking Volume
Total Leads Value
Total Pipeline Value
Total Booking Value
Marketing Performance Summary
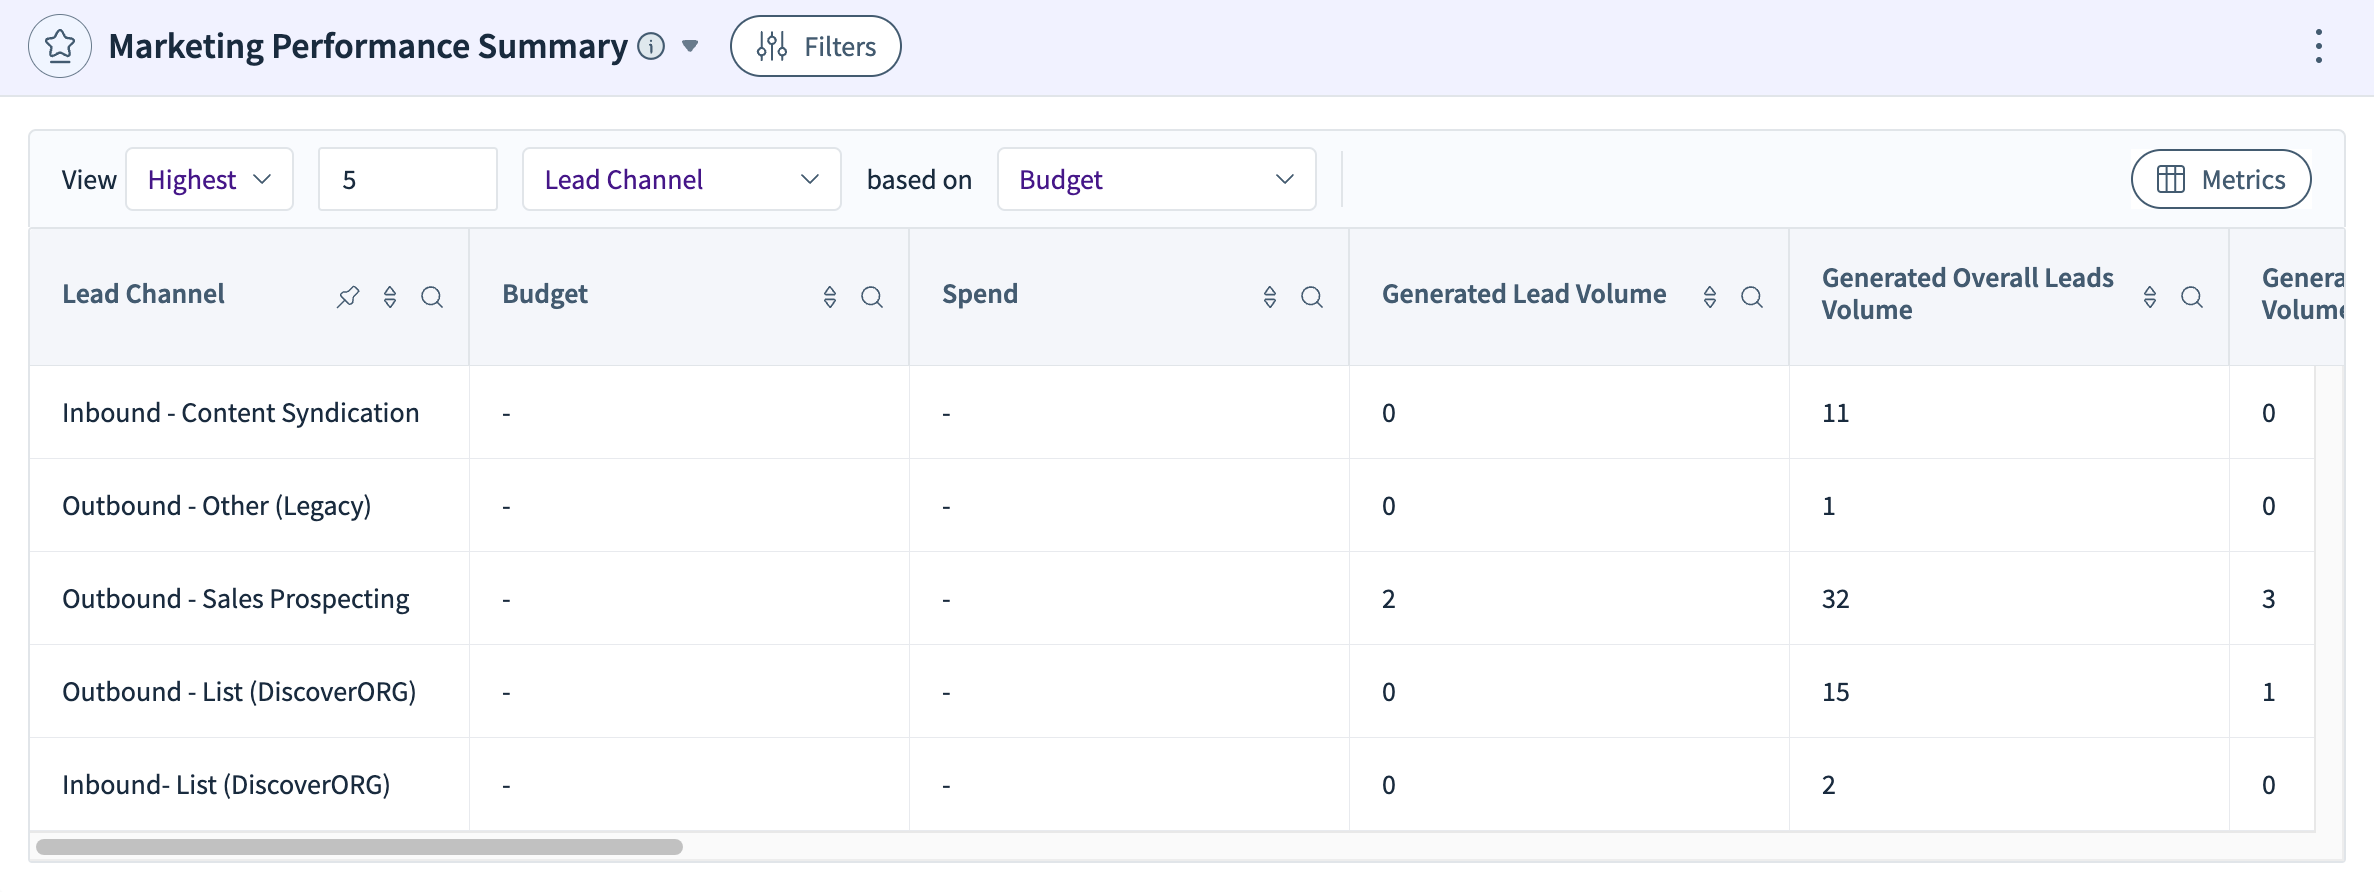
This section has a table of the ‘X’ items that are either ‘Highest’ or ‘Lowest’. The items in the list can be either ‘Lead Channel’, ‘Campaign Name’, or ‘Campaign Type’. These are sorted based on one of the metrics from the list below. Also, the same metrics can be viewed as columns of the table when selected from the ‘Metrics’ dropdown.
List of metrics for sorting and viewing:
Budget
Spend
Generated Lead Volume
Generated Overall Leads Volume
Generated Pipeline Volume
Generated Booking Volume
Generated Pipeline Value
Generated Booking Value
Gross Cost Per Lead
Pipeline ROI
Booking ROI
Projected Pipeline Value
Projected Booking Value
Projected Pipeline ROI
Projected Booking ROI
Projected Pipeline Volume
Projected Booking Volume
Demand Generation Effectiveness
.png)
This section helps you assess the effectiveness of demand generation. You can choose one or more dimensions from a list of 'Lead channel, 'Campaign Name,’ and 'Campaign type’. These would be the rows of the table. The columns of the table can be selected from the ‘Metrics’ dropdown. The available metrics to view are:
Budget
Spend
Generated Lead Volume
Generated Overall Leads Volume
Generated Pipeline Volume
Generated Booking Volume
Generated Pipeline Value
Generated Booking Value
Gross Cost Per Lead
Pipeline ROI
Booking ROI
Projected Pipeline Value
Projected Booking Value
Projected Pipeline ROI
Projected Booking ROI
Projected Pipeline Volume
Projected Booking Volume
Additionally, you also have the ability to view additional data and trends based on data and metrics in the table. These are:
Campaign Contribution: The campaign contribution percentages can be viewed for various metrics are additional columns in the table. There are two types of contributions:
Contribution %: This is the percentage of contribution by a campaign to the overall pipeline (including non-campaign-related leads).
Relative Contribution %: This is the percentage of contribution by a campaign to the contributions by all other campaigns to the pipeline.
Smart Filter: Using this, you can create your own custom rules for filtering data using one or more conditions.
Funnel View: This inserts a column with a graphical representation of the funnel view for that particular row, which shows the volume contribution to each stage of the funnel, like ‘Lead’, ‘MQL’, ‘Pre-SAL’, and ‘SAL’. You can view this for the generated pipeline or the open pipeline.
View Growth: This gives a number for growth/degrowth per row for the selected metrics to show how the metric has changed over time. You can choose the time window for comparison as ‘Weekly’, ‘Monthly’, or ‘Quarterly’. And the growth can be ‘Cumulative’ or ‘Relative’.
View Trends: Using this option, you can view trends for up to 6 metrics per row of the table. The trends can be ‘WoW’, ‘MoM, or ‘QoQ’.
Color Code Cells: When this is toggled ON, you can select the Metrics for which you want color coding. There are 4 color gradings for every selected metric as follows:
Dark green: Top 25 percentile
Light green: 50-75 percentile
Light red: 25-50 percentile
Dark red: Bottom 25 percentile
Journeys
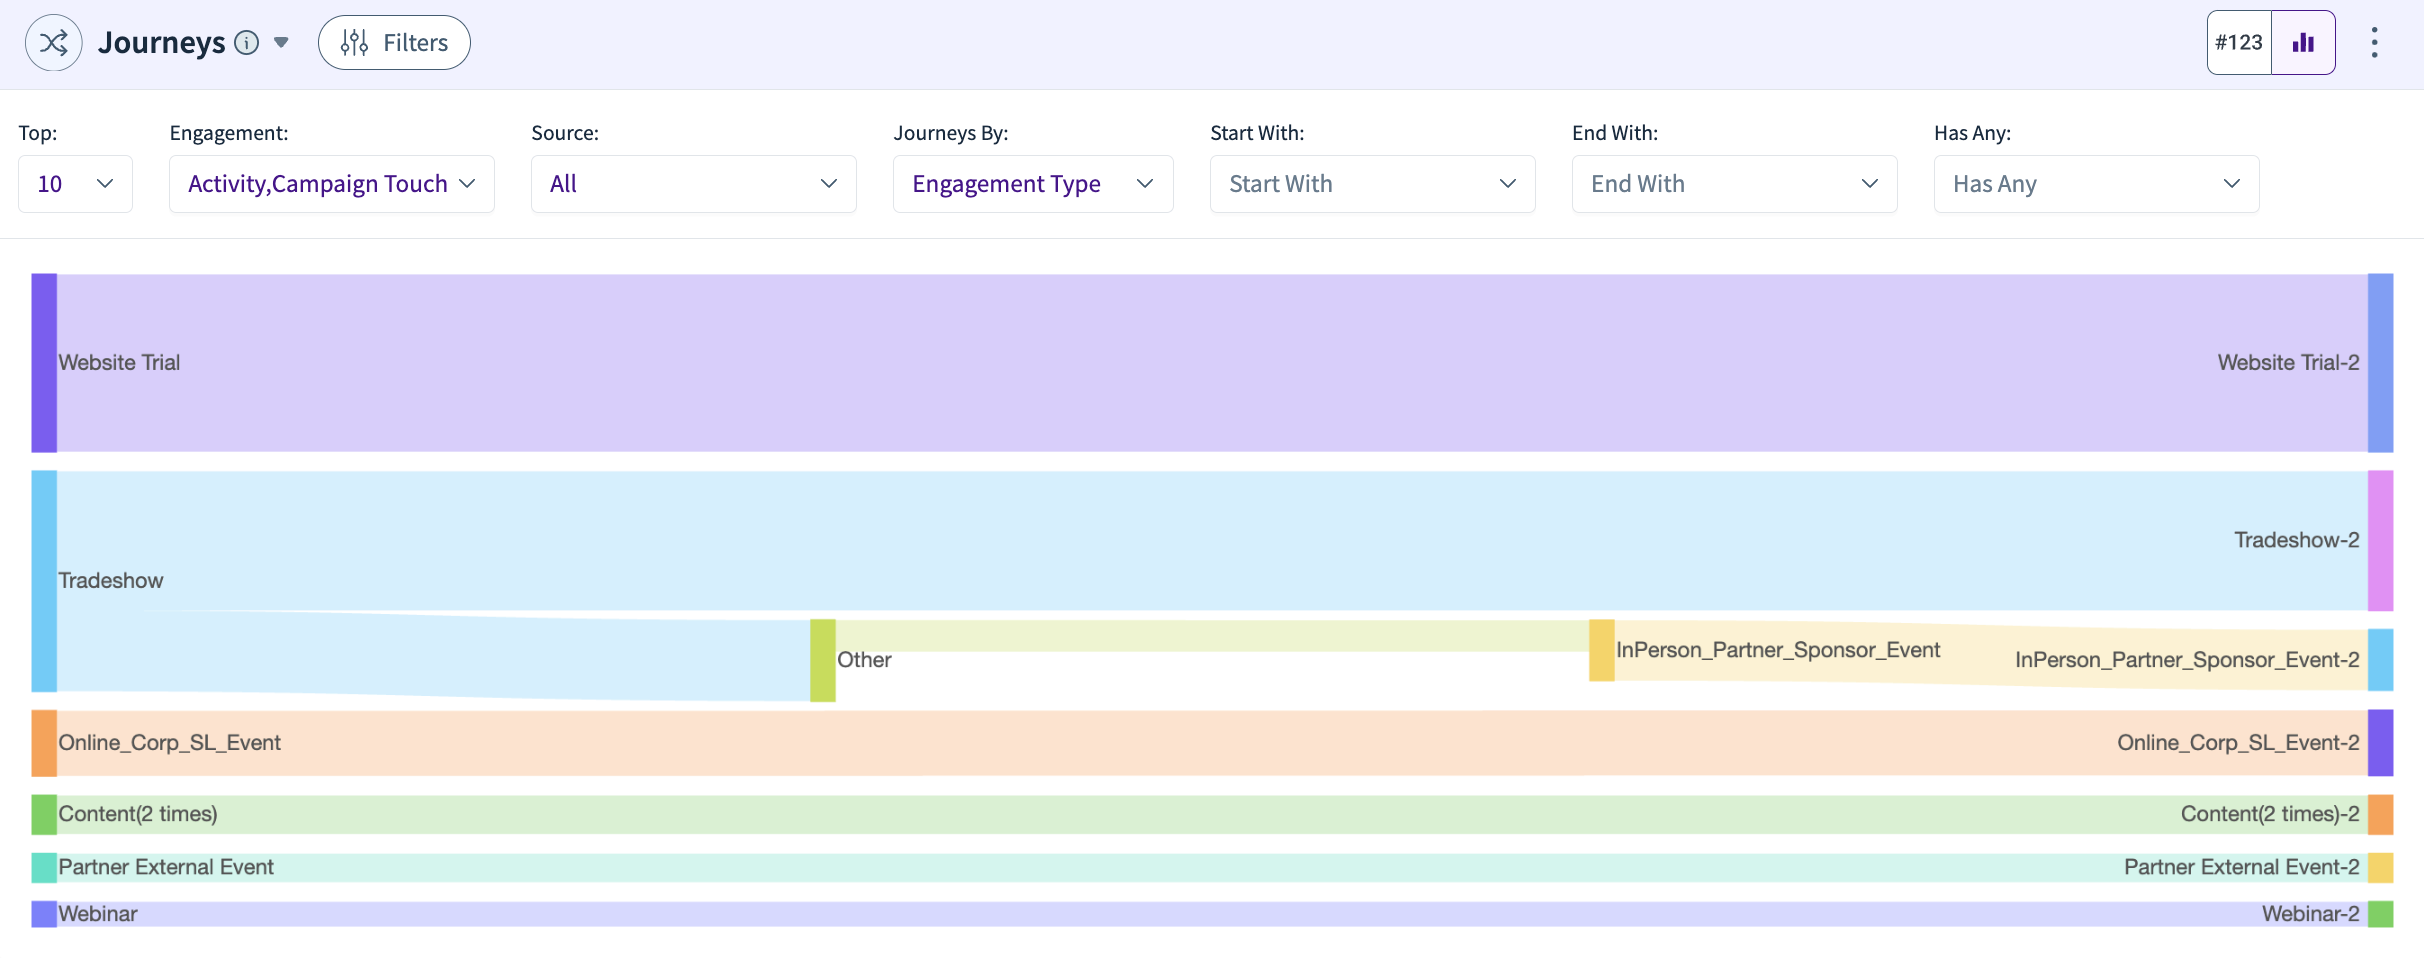
The Journey chart is very helpful in understanding various user journeys. You can use the ‘Filters’ to select what type of journey you want to focus on, along with the time window and the progression stage.
Just above the chart, you can select various parameters (see the list below) to further analyse various types of journeys:
Top X
Engagement
Source
Journeys By
Start With
End With
Has Any
Deep Funnel Contribution
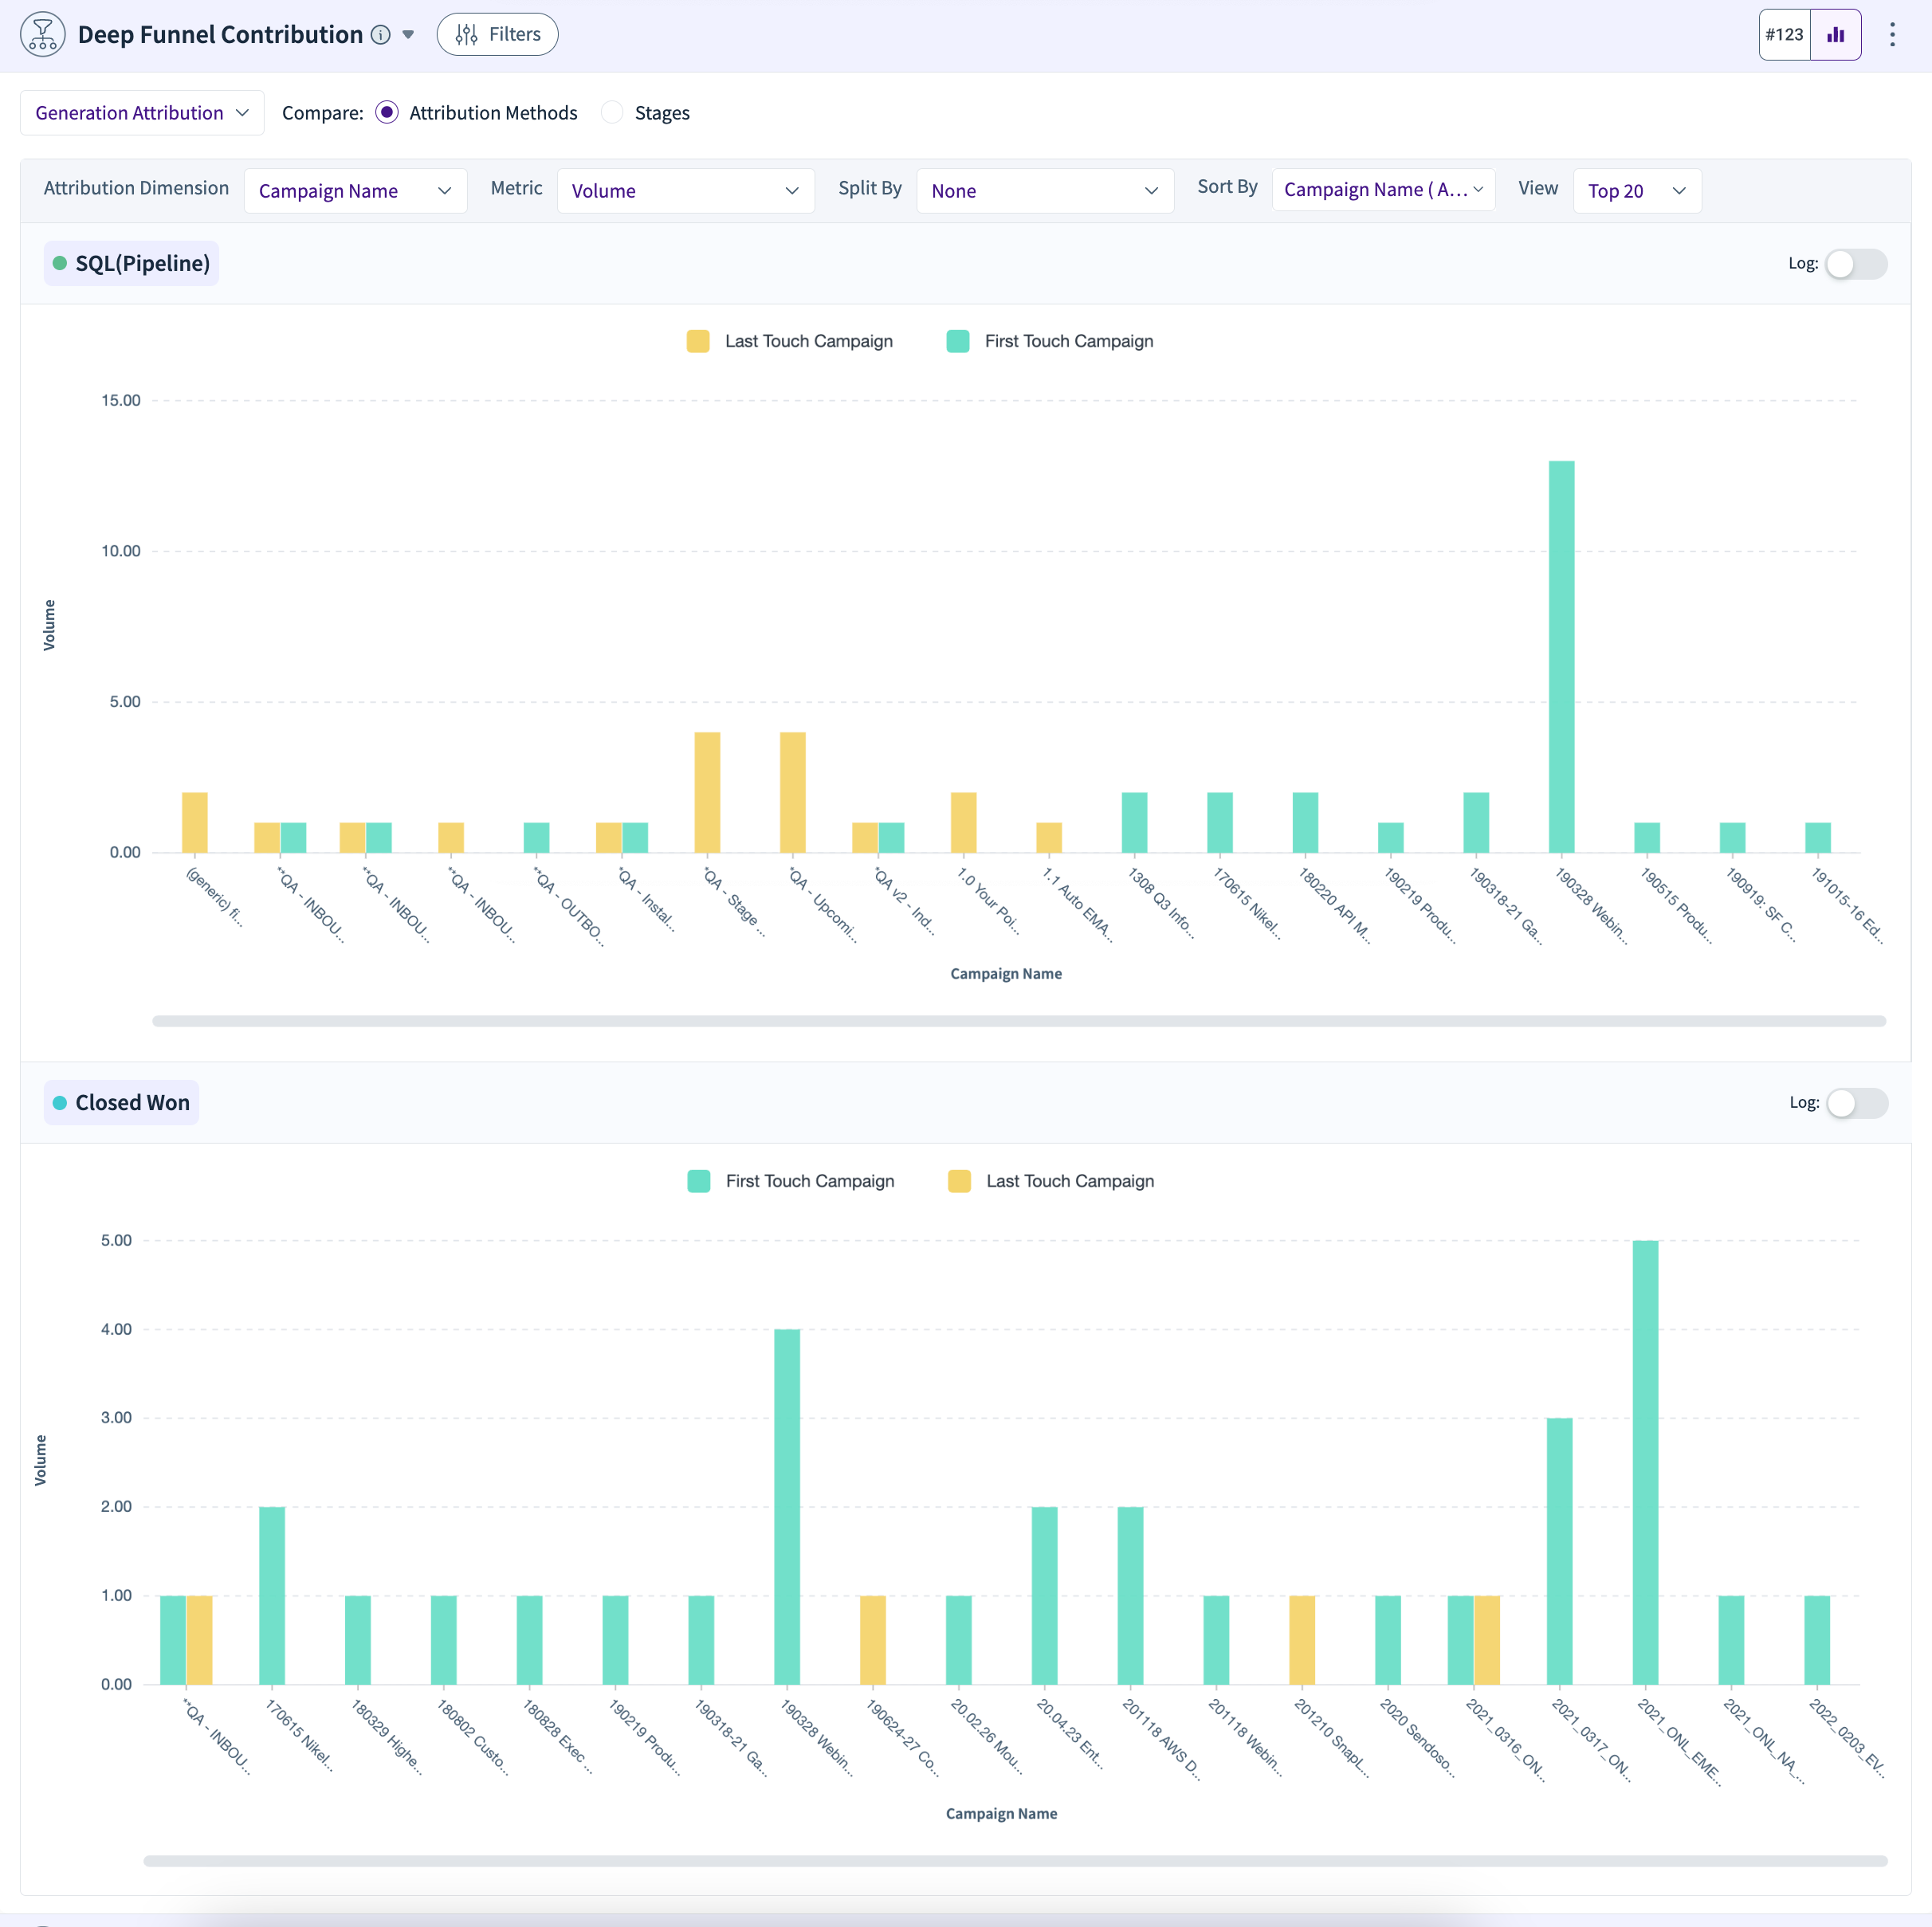
These charts/tables help you analyse and understand your deep funnel and its contributions. The two charts are for SQL (Pipeline) and Closed Won. As before, you can select the data and dimensions that you desire from the 'Filters’ section.
You can then deep dive into 'Generation Attribution’ or 'Leakage Attribution’. The charts in this section can help you compare the various ‘Attribution Methods’. You can drill down and sort using the following parameters:
Attribution Dimension
Metric
Split By
Sort By
View Top X
You can also change the view based on the ‘Stages’. When selected, the charts are for the ‘First Touch Campaign’ and ‘Last Touch Campaign’ attribution types. Each of these charts will have the SQL (Pipeline) and Closed Won stages and show a stacked column graph to compare the contributions of various campaigns by name or type.
Marketing Influence
.png)
This section helps you analyse the impact of digital channels on lead generation. You can use the ‘Filters’ to select the data dimension type and the time period. If you switch ON the ‘Stages’ toggle, the cards will show you the contribution of ‘Touched’ and ‘Non-Touched’ for various stages in the funnel.
Campaign Reallocation
.png)
The Campaign Spend Reallocation module helps you reallocate the spending from your paid campaigns to maximize your ROI. Marketing teams do not have an ROI perspective on the campaigns they run and are often unsure of the unit economics attached to them. RevSure helps recommend which campaigns to invest in and which campaigns to divest based on the Return on Investment from both Pipeline and Booking perspectives.
You can select the Top X for the left section and the Bottom Y for the right section based on metrics like ‘Pipeline Generated’, ‘Booking Generated’, ‘Pipeline ROI’, etc. You will see some of the summarized metrics followed by tables with respective ‘X’ and ‘Y’ number of rows. For each table, you can select the ‘Columns’ to view.
Campaign Budget vs Spend Tracking
Compare the amount of money being spent on campaigns against the budget to see performance.
Funnel Health
Funnel Health Metrics
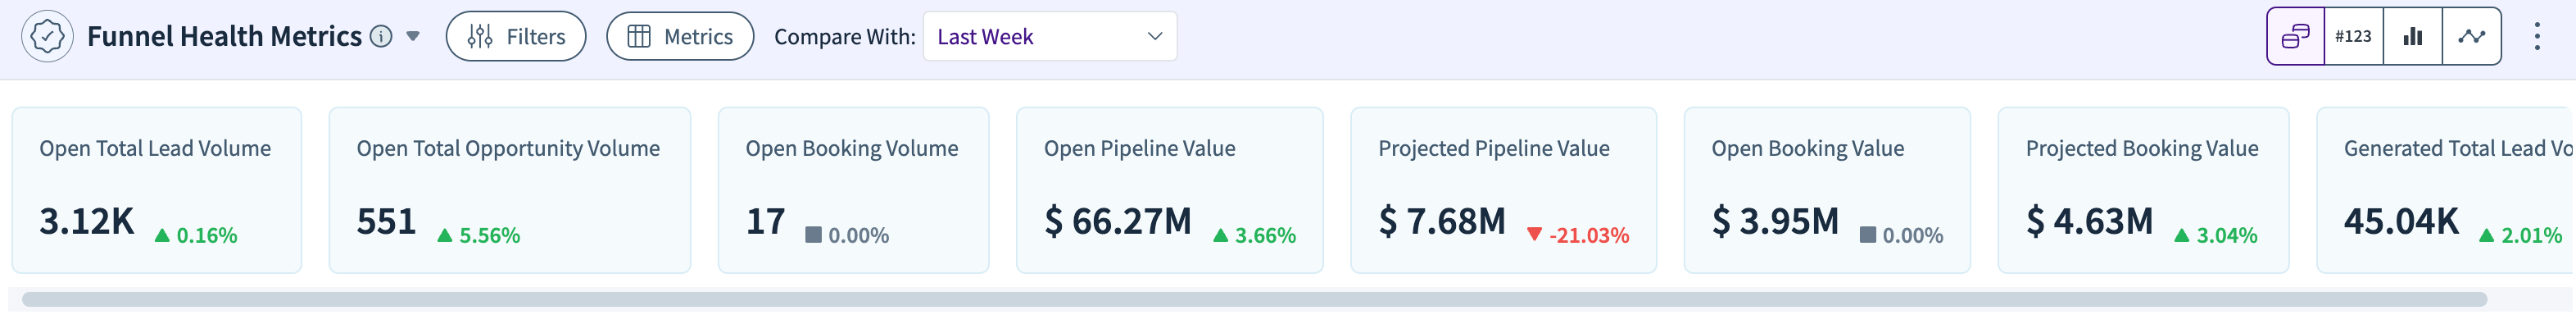
Various metrics help you assess the health of your funnel. These can be viewed as cards, table (trends), column chart or trend chart.
Pipeline & Booking Value of Funnel
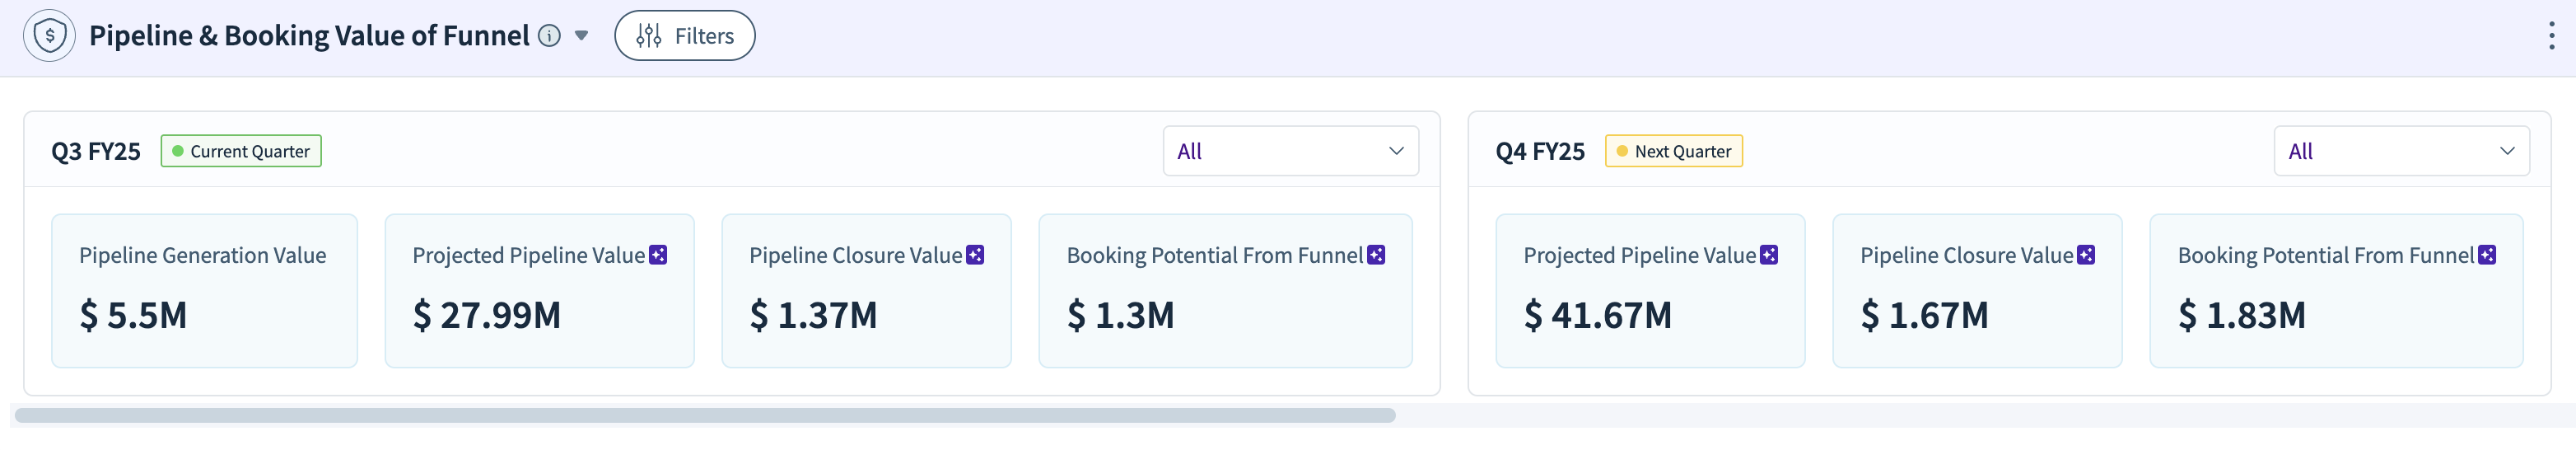
Displays the metrics related to potential booking and pipeline value for your funnel. It included metrics like ‘Pipeline Generation Value’, ‘Projected pipeline Value’, ‘Pipeline Closure Value, ‘Booking Potential from Funnel’, etc., for the current and future quarters.
Snapshot Funnel and Pipeline KPIs
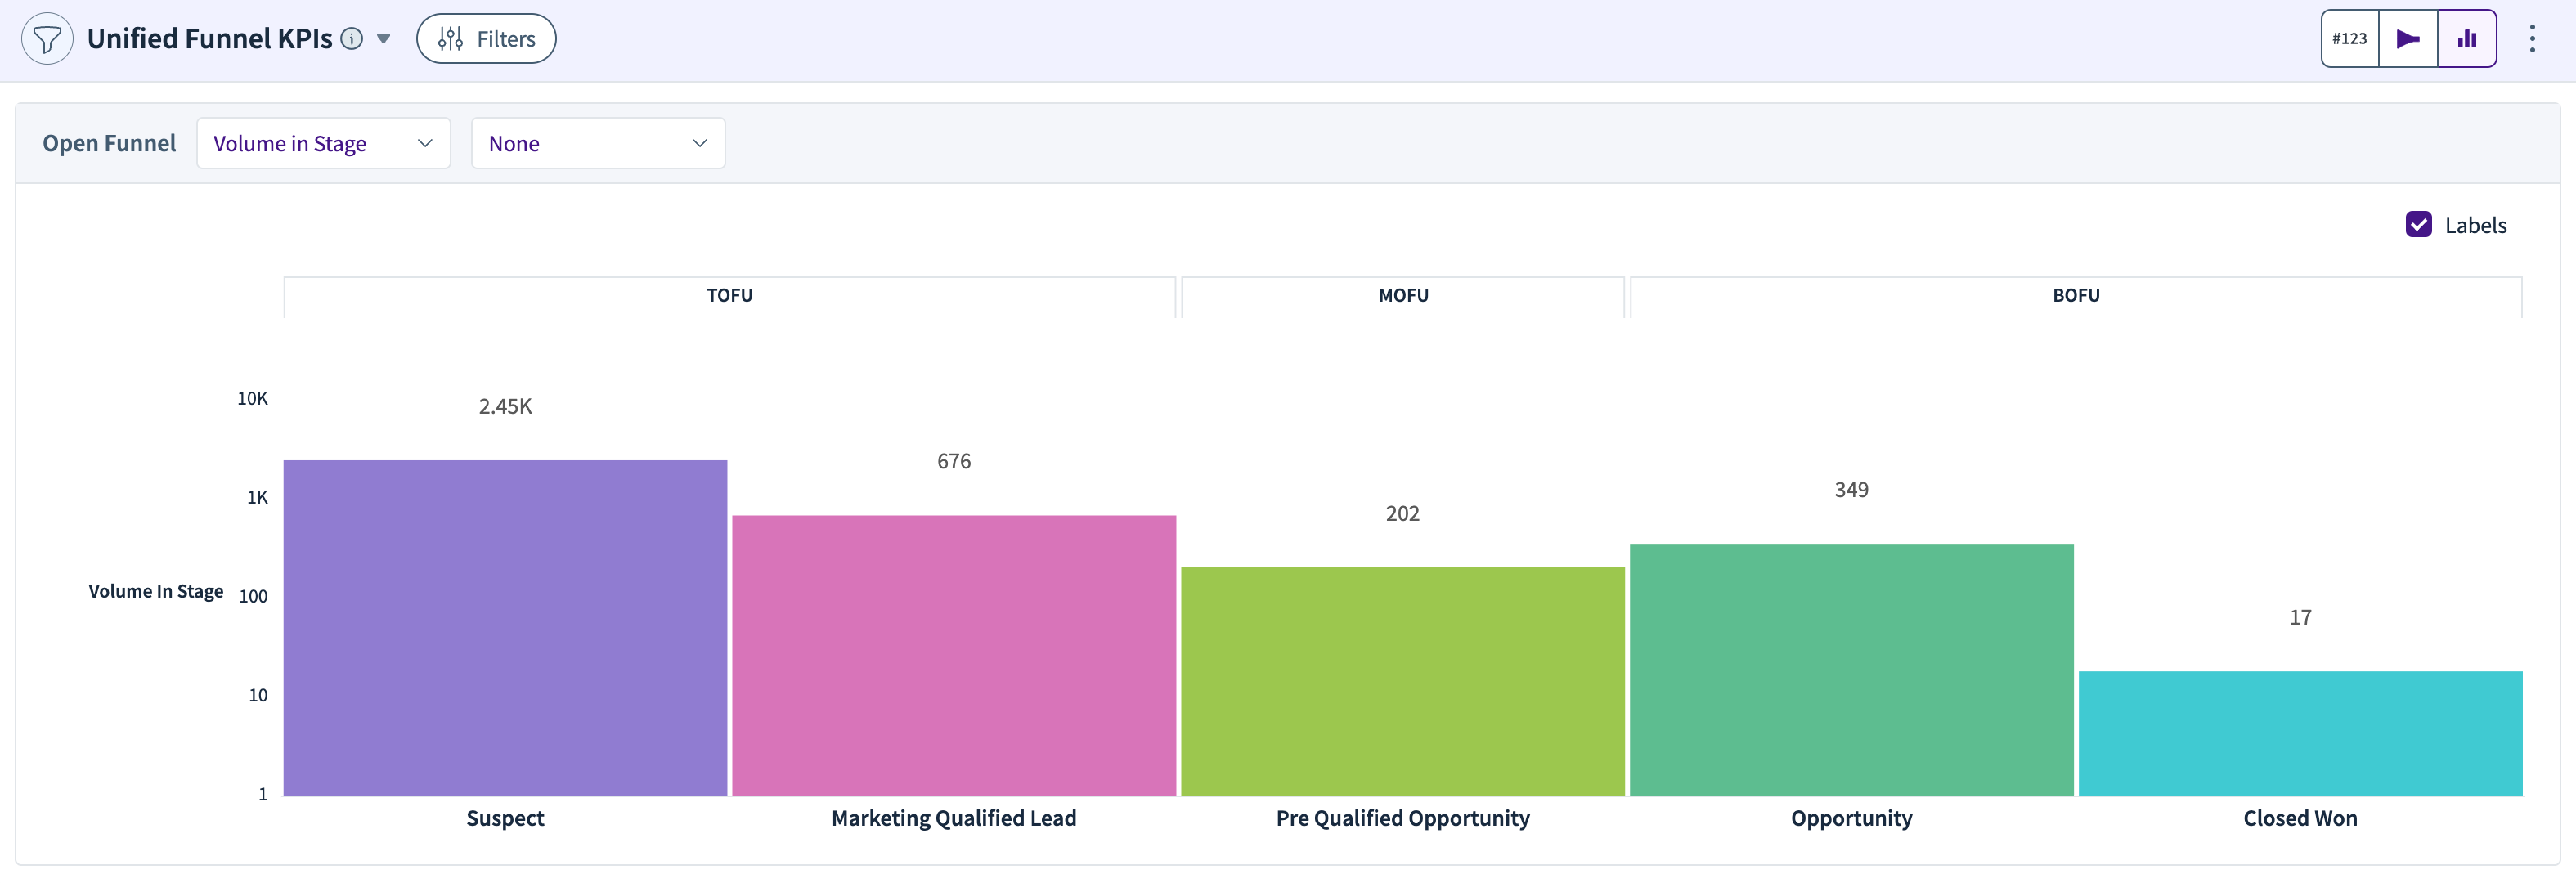
This widget summarises key performance indicators for your open funnel, such as lead volume and pipeline value. You can switch between the table view, funnel view, and the chart view.
Funnel Breakdown
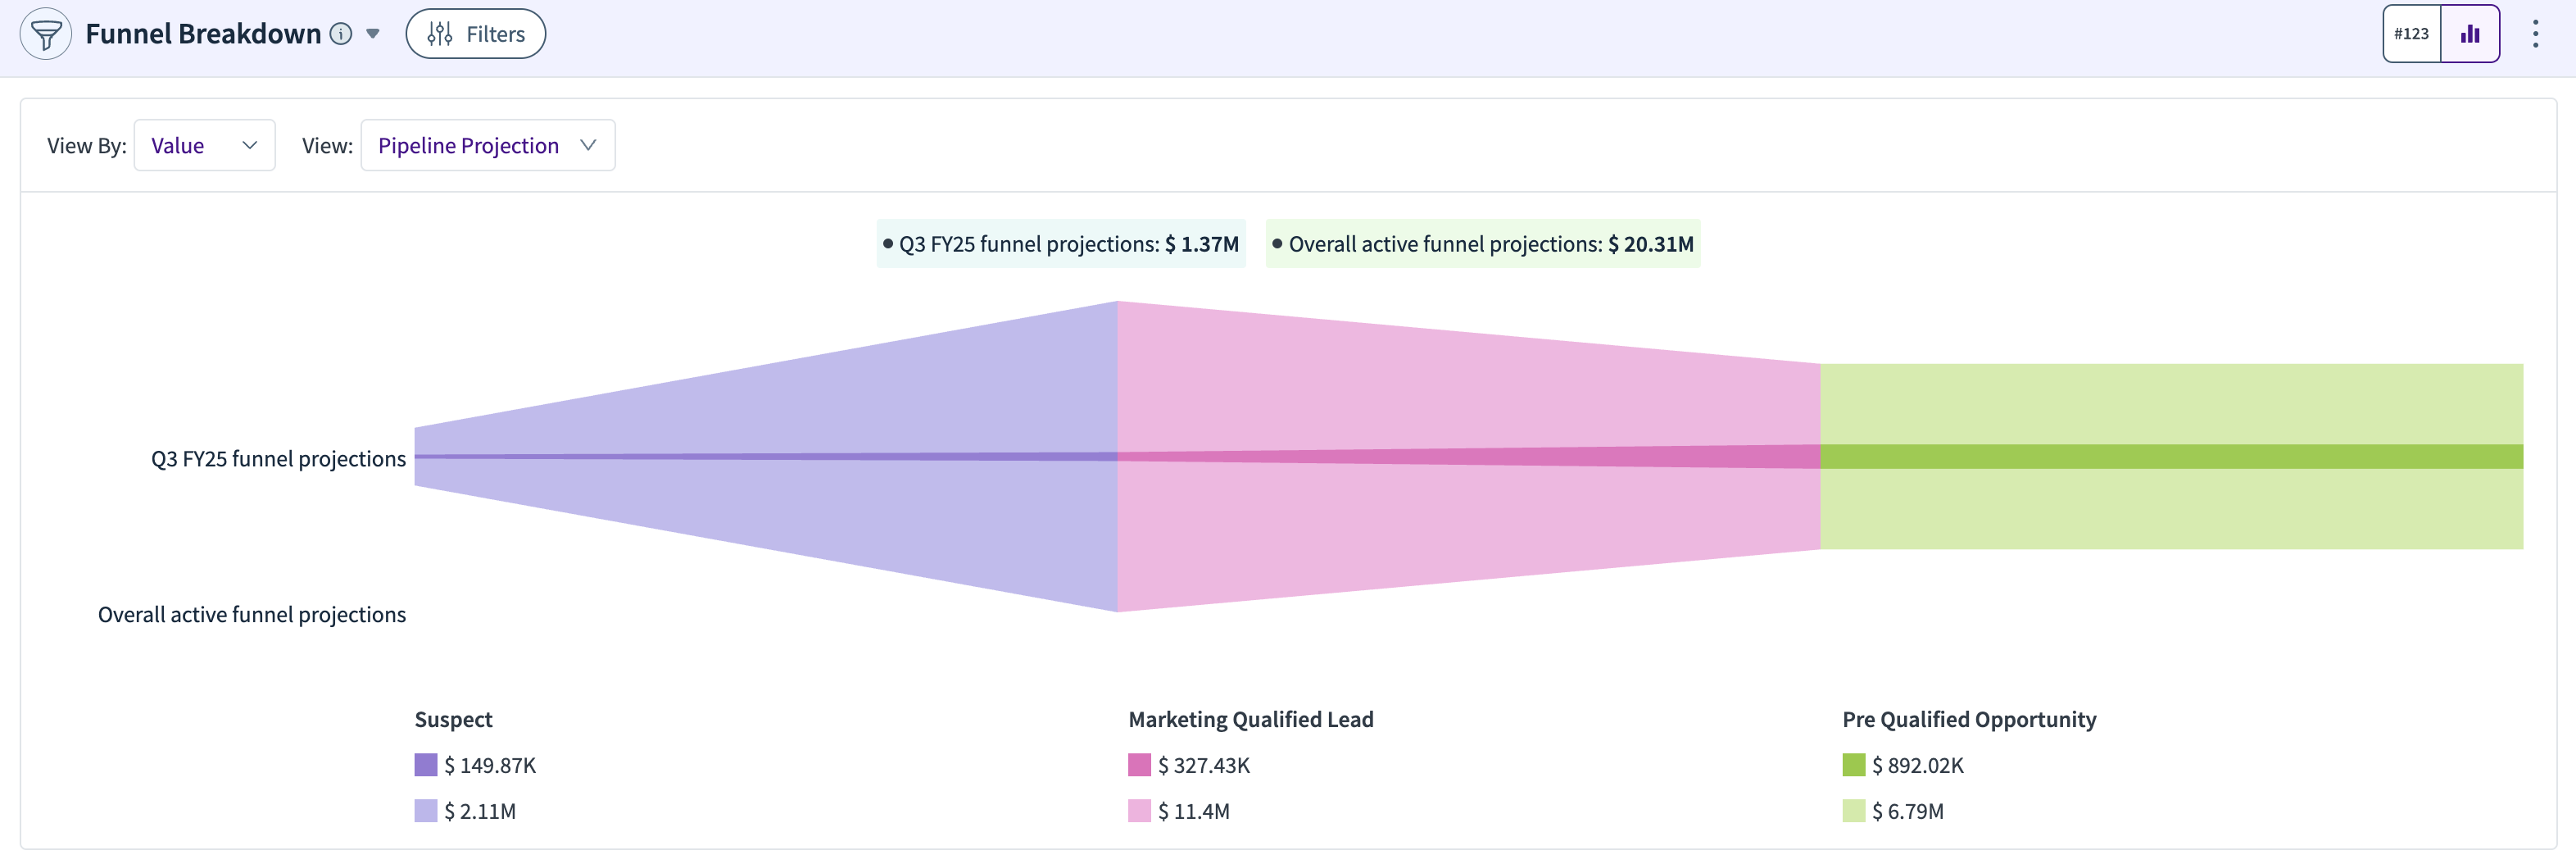
Breaks down your funnel's stages with details like the value of leads in the "Marketing Qualified Lead" stage and opportunities in the "Pre-Qualified Opportunity" stage.
Stage Deepdive
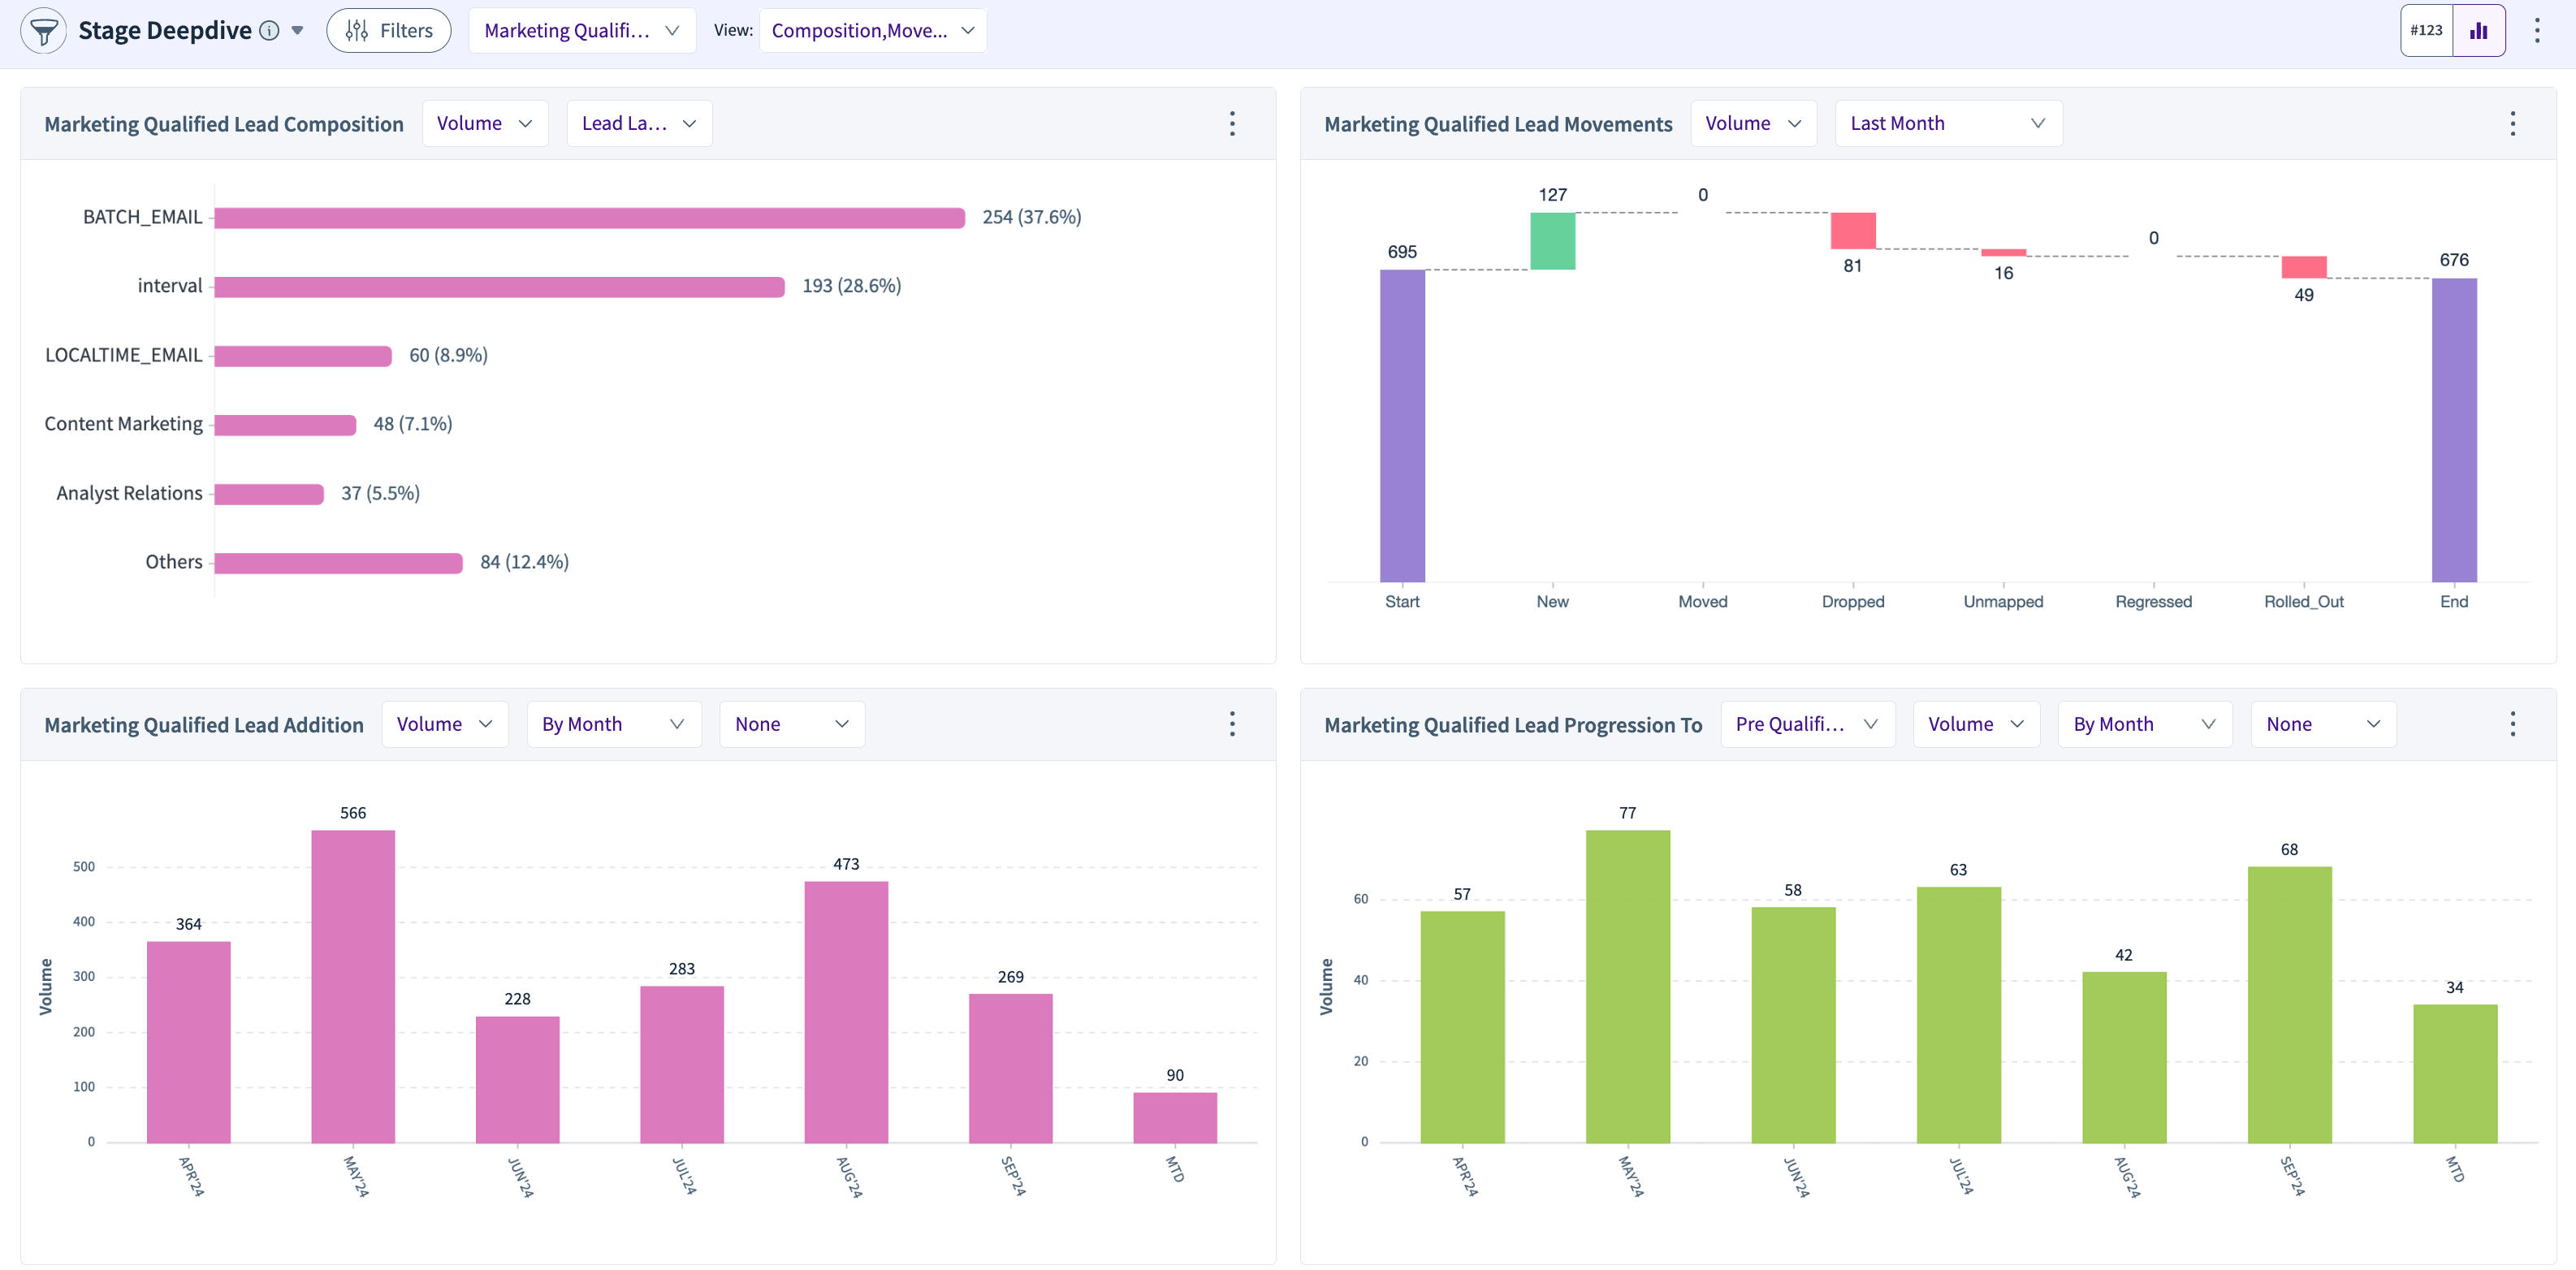
This widget offers details and views for any selected funnel stage. After selecting a stage, you can deep dive into its composition, movements, addition, progression, and leakage details and view these either as a table or as charts.
Movements
The Movements component indicates how your leads have changed from the start of the rolling week/month/quarter to the end of it.
Start indicates how much you started your rolling week/month/quarter with.
New indicates how much you added over the course of the rolling period
Moved shows the number of leads that progressed out of the stage
Dropped is the number of leads that got leaked
Unmapped indicates any movements to the states in the source system that are not mapped to the RevSure funnel stages
Regressed show the number of leads that regressed to a previous stage
Rolled_Out refers to leads that were counted as leads in the "start" but are no longer counted at the "end" because of the rolling window.
In the above example, we look at the movements in a sliding window of 1 month, over a period of 365 days. Rolled out here refers to the leads that continue to remain as leads and were created in the first month of the original window, but due to the window being moved by 1 month, they stop showing up as created leads. For example, in a window of Jan 1 - Jan 31, a lead that was created on Dec 25 will be there in the start stage, because it was open as of Jan 1. But it will be rolled out as of Jan 31, because it was created outside of the window.
Conversion Summary
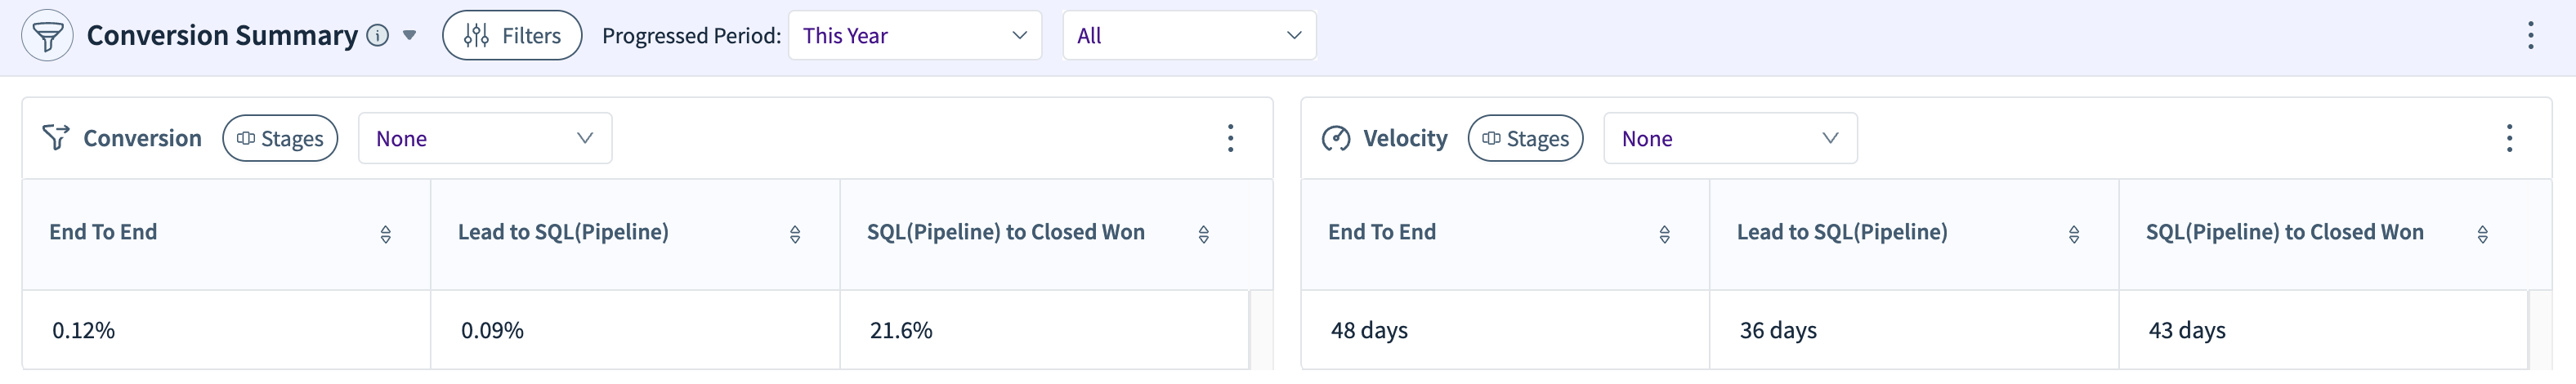
This widget gives you the conversion and velocity summaries for end-to-end conversions, leads to opportunities, and opportunities to closed won.
Conversion Deepdive
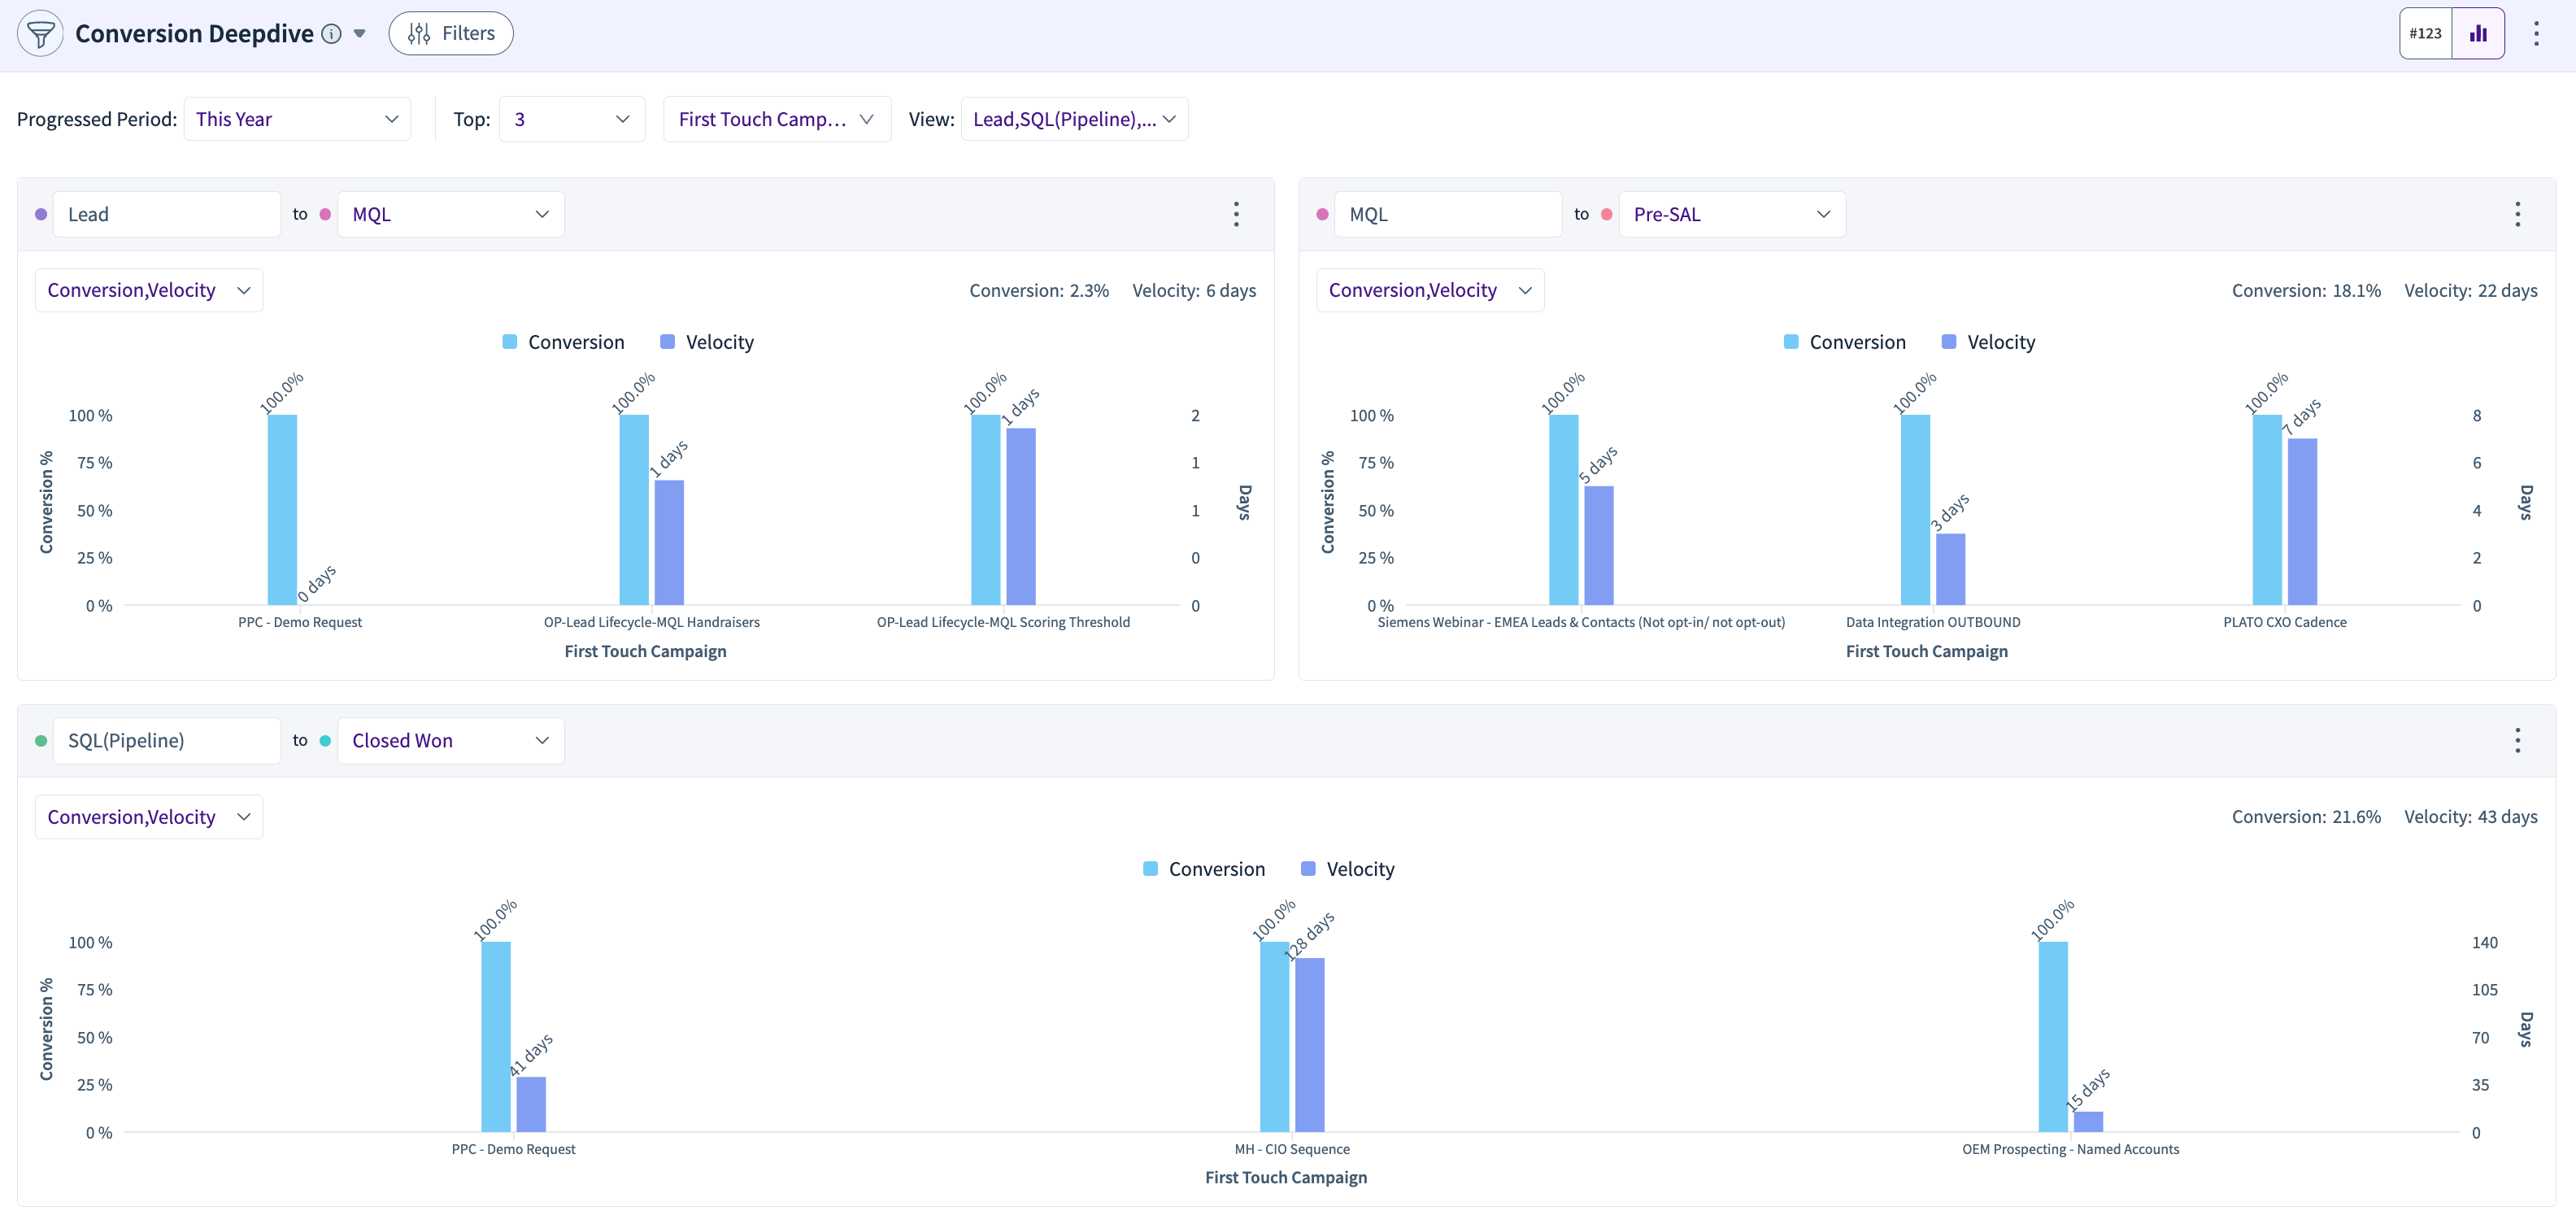
Analyzes conversions from one stage to another, identifying top contributors, such as "Marketing Qualified Leads" converting to "Opportunities" and the percentage of conversion (e.g., 15.9%).
Funnel Addition Overview
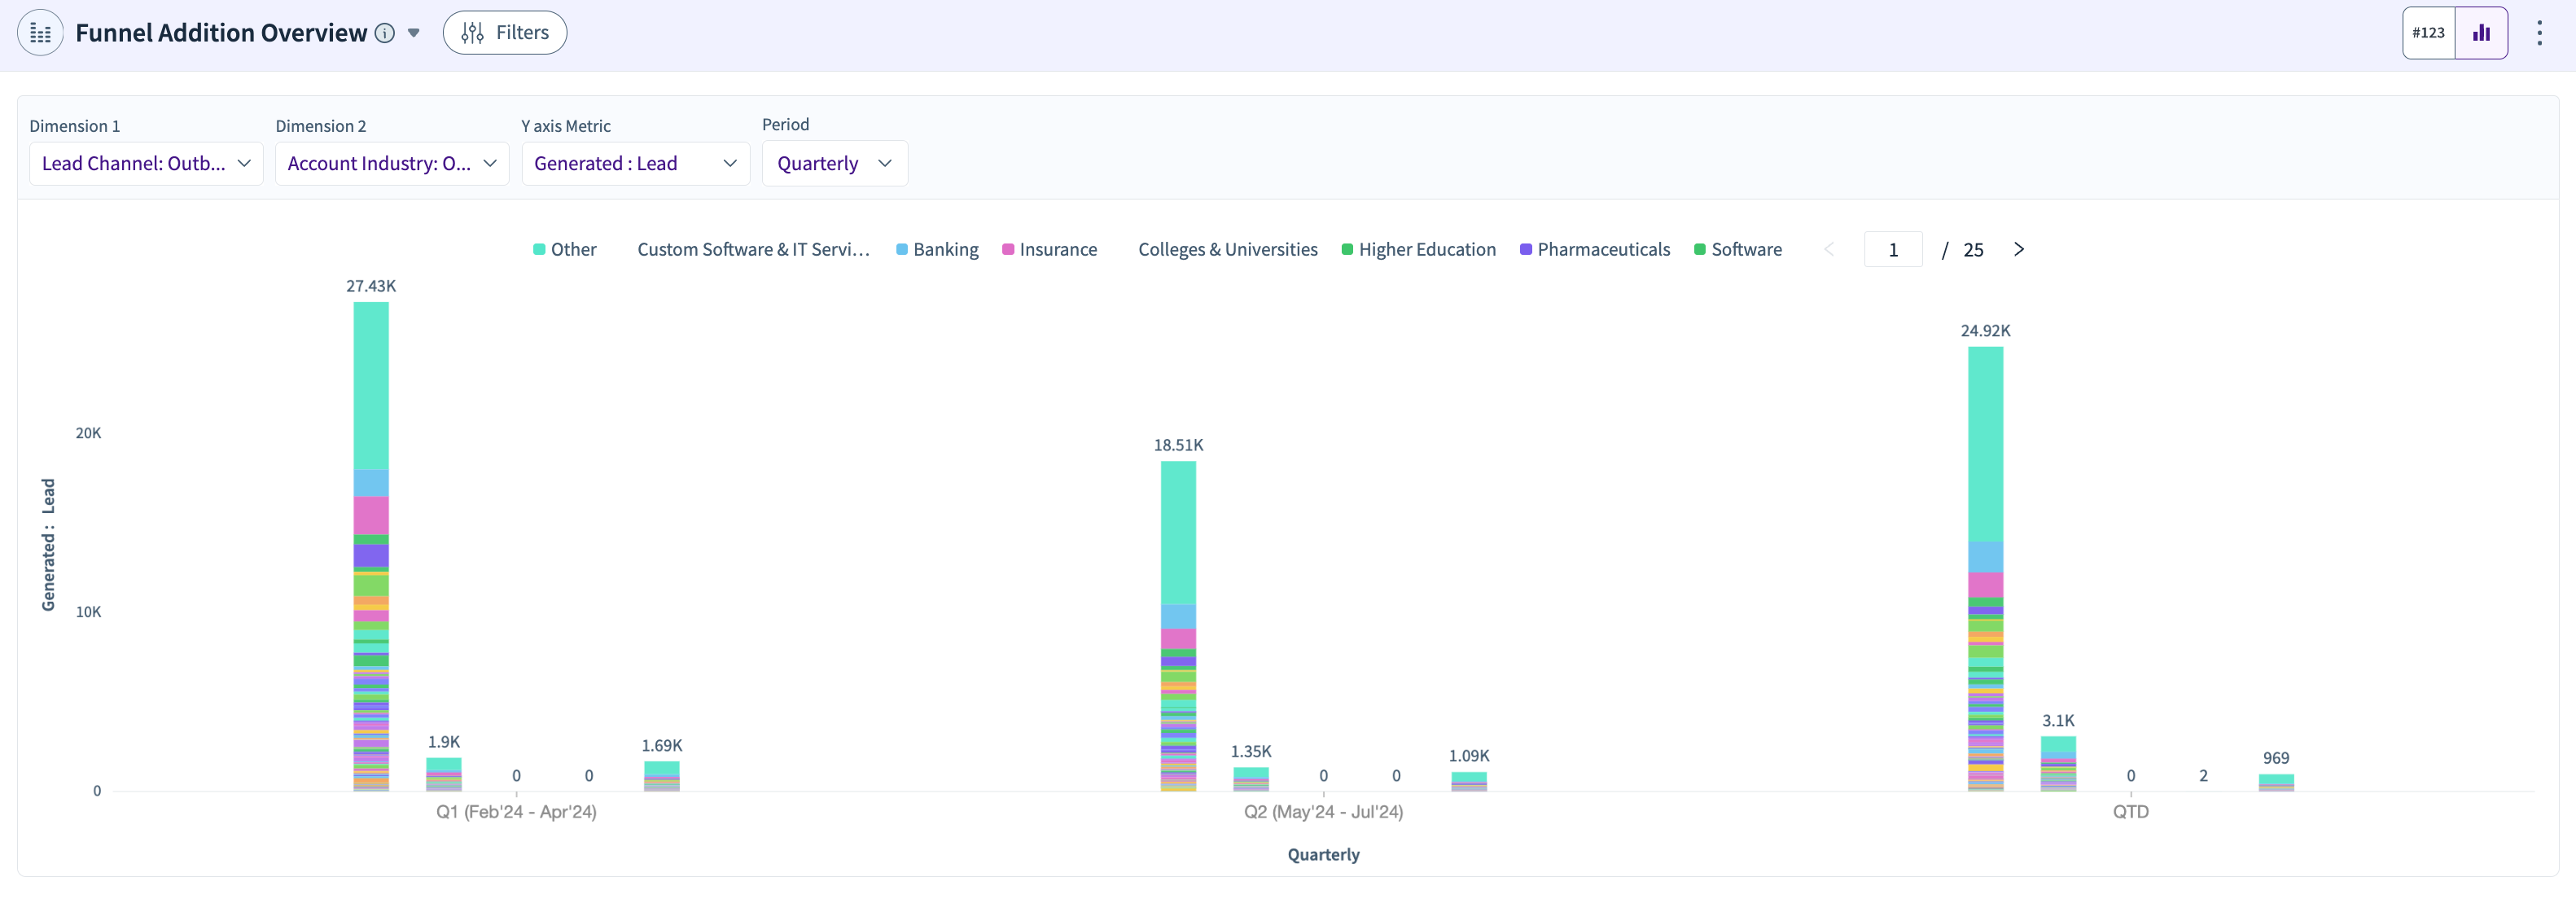
Provides an overview of new leads and opportunities (Weekly, Monthly, Quarterly) added to the funnel, including metrics like "Suspect Addition" and "Opportunity Addition.
Targets & Attainment
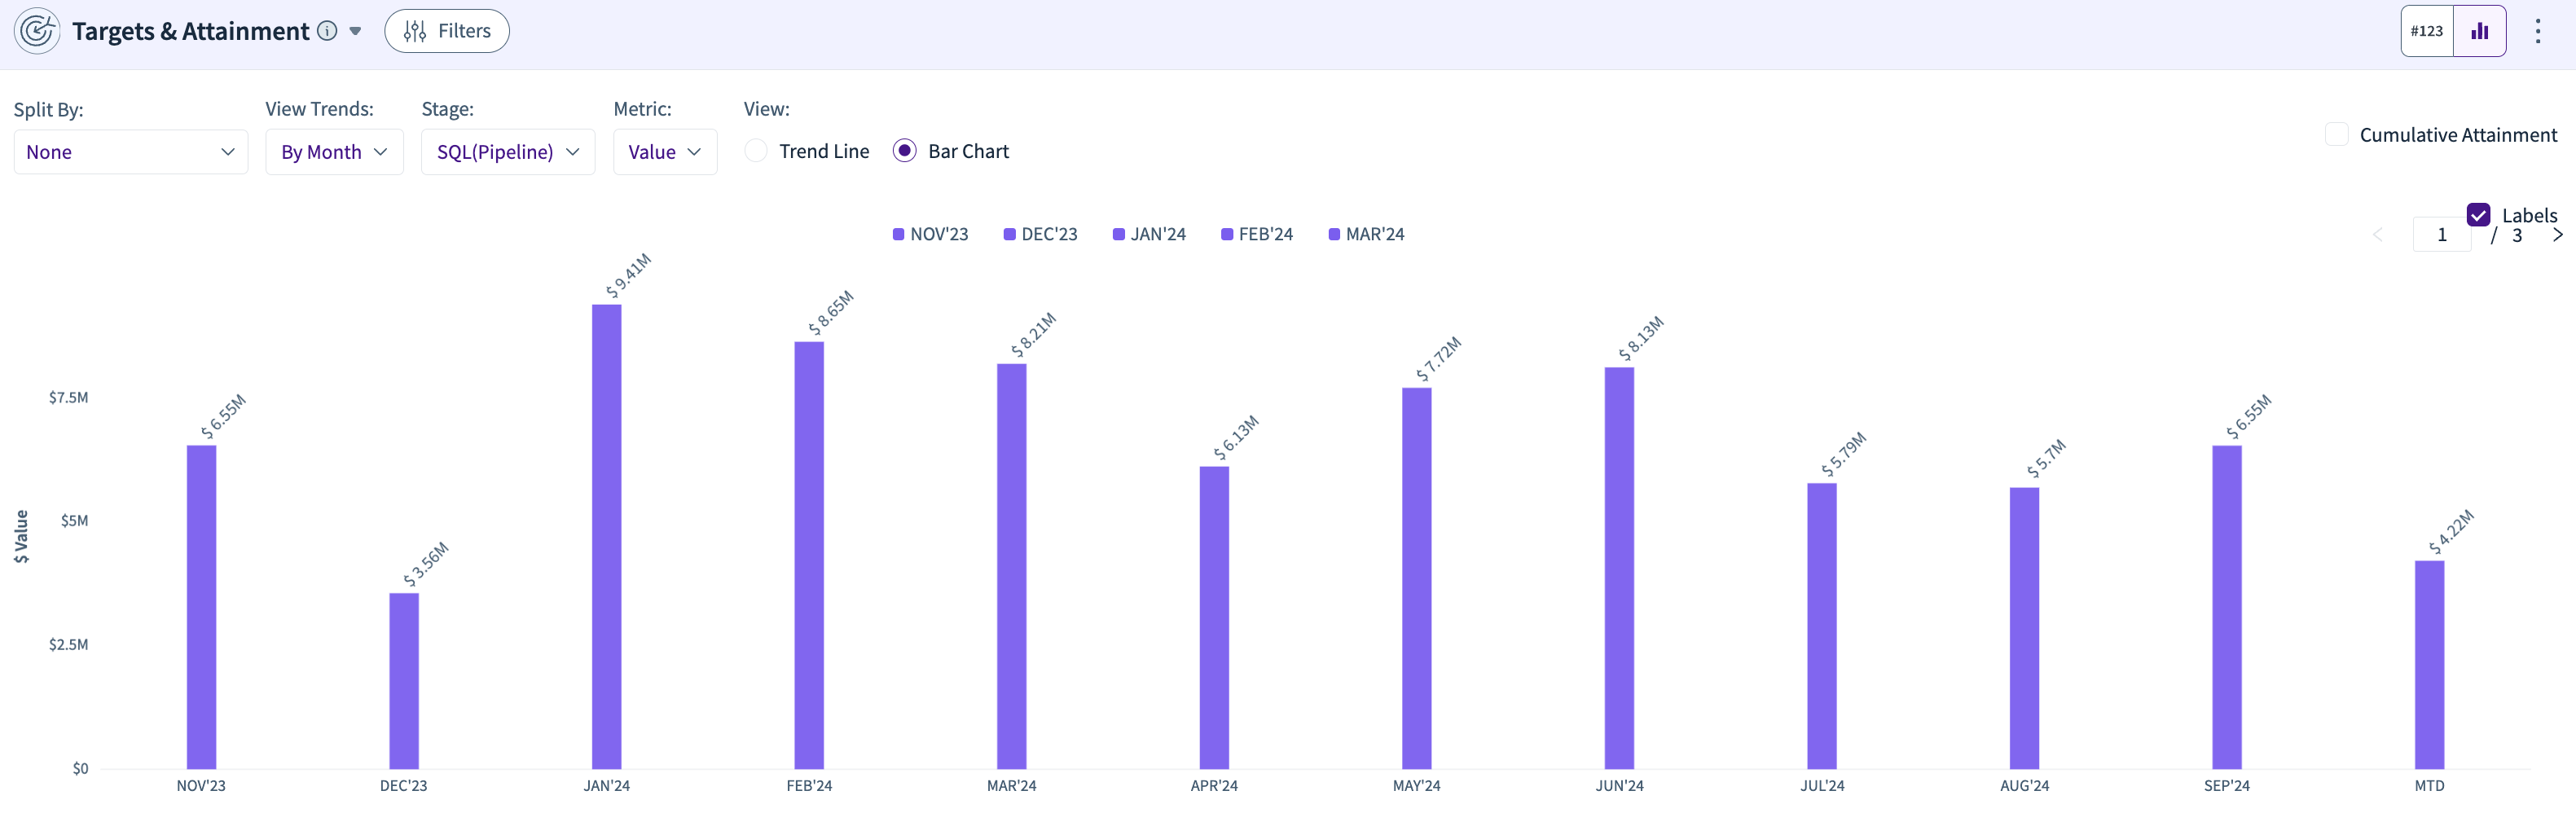
Analyzes how well the funnel meets its targets by comparing metrics like "Pipeline Target" versus "Attainment", showing how close the funnel is to hitting targets.
Conversion Trends
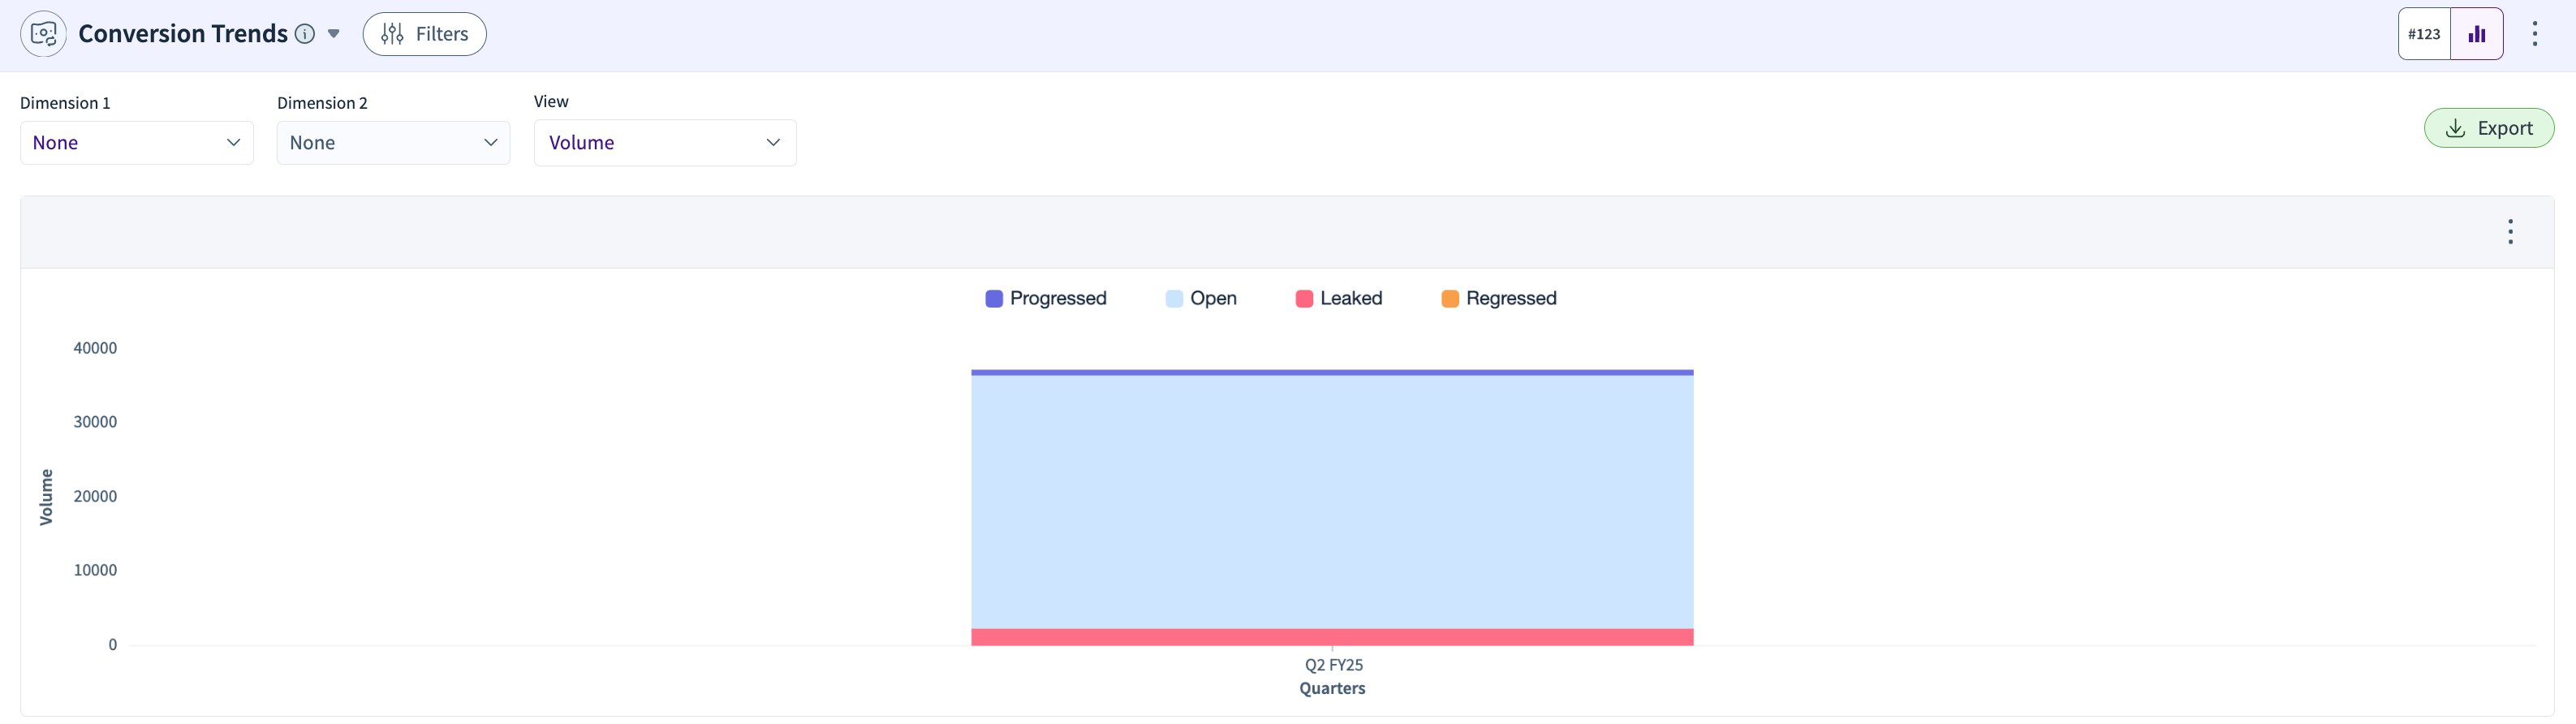
Shows how conversion rates evolve, e.g., a trend showing the conversion from "Suspect" to "Qualified Lead" improving from 4% to 6% over a quarter.
Cohort Analysis - Single Start Stage
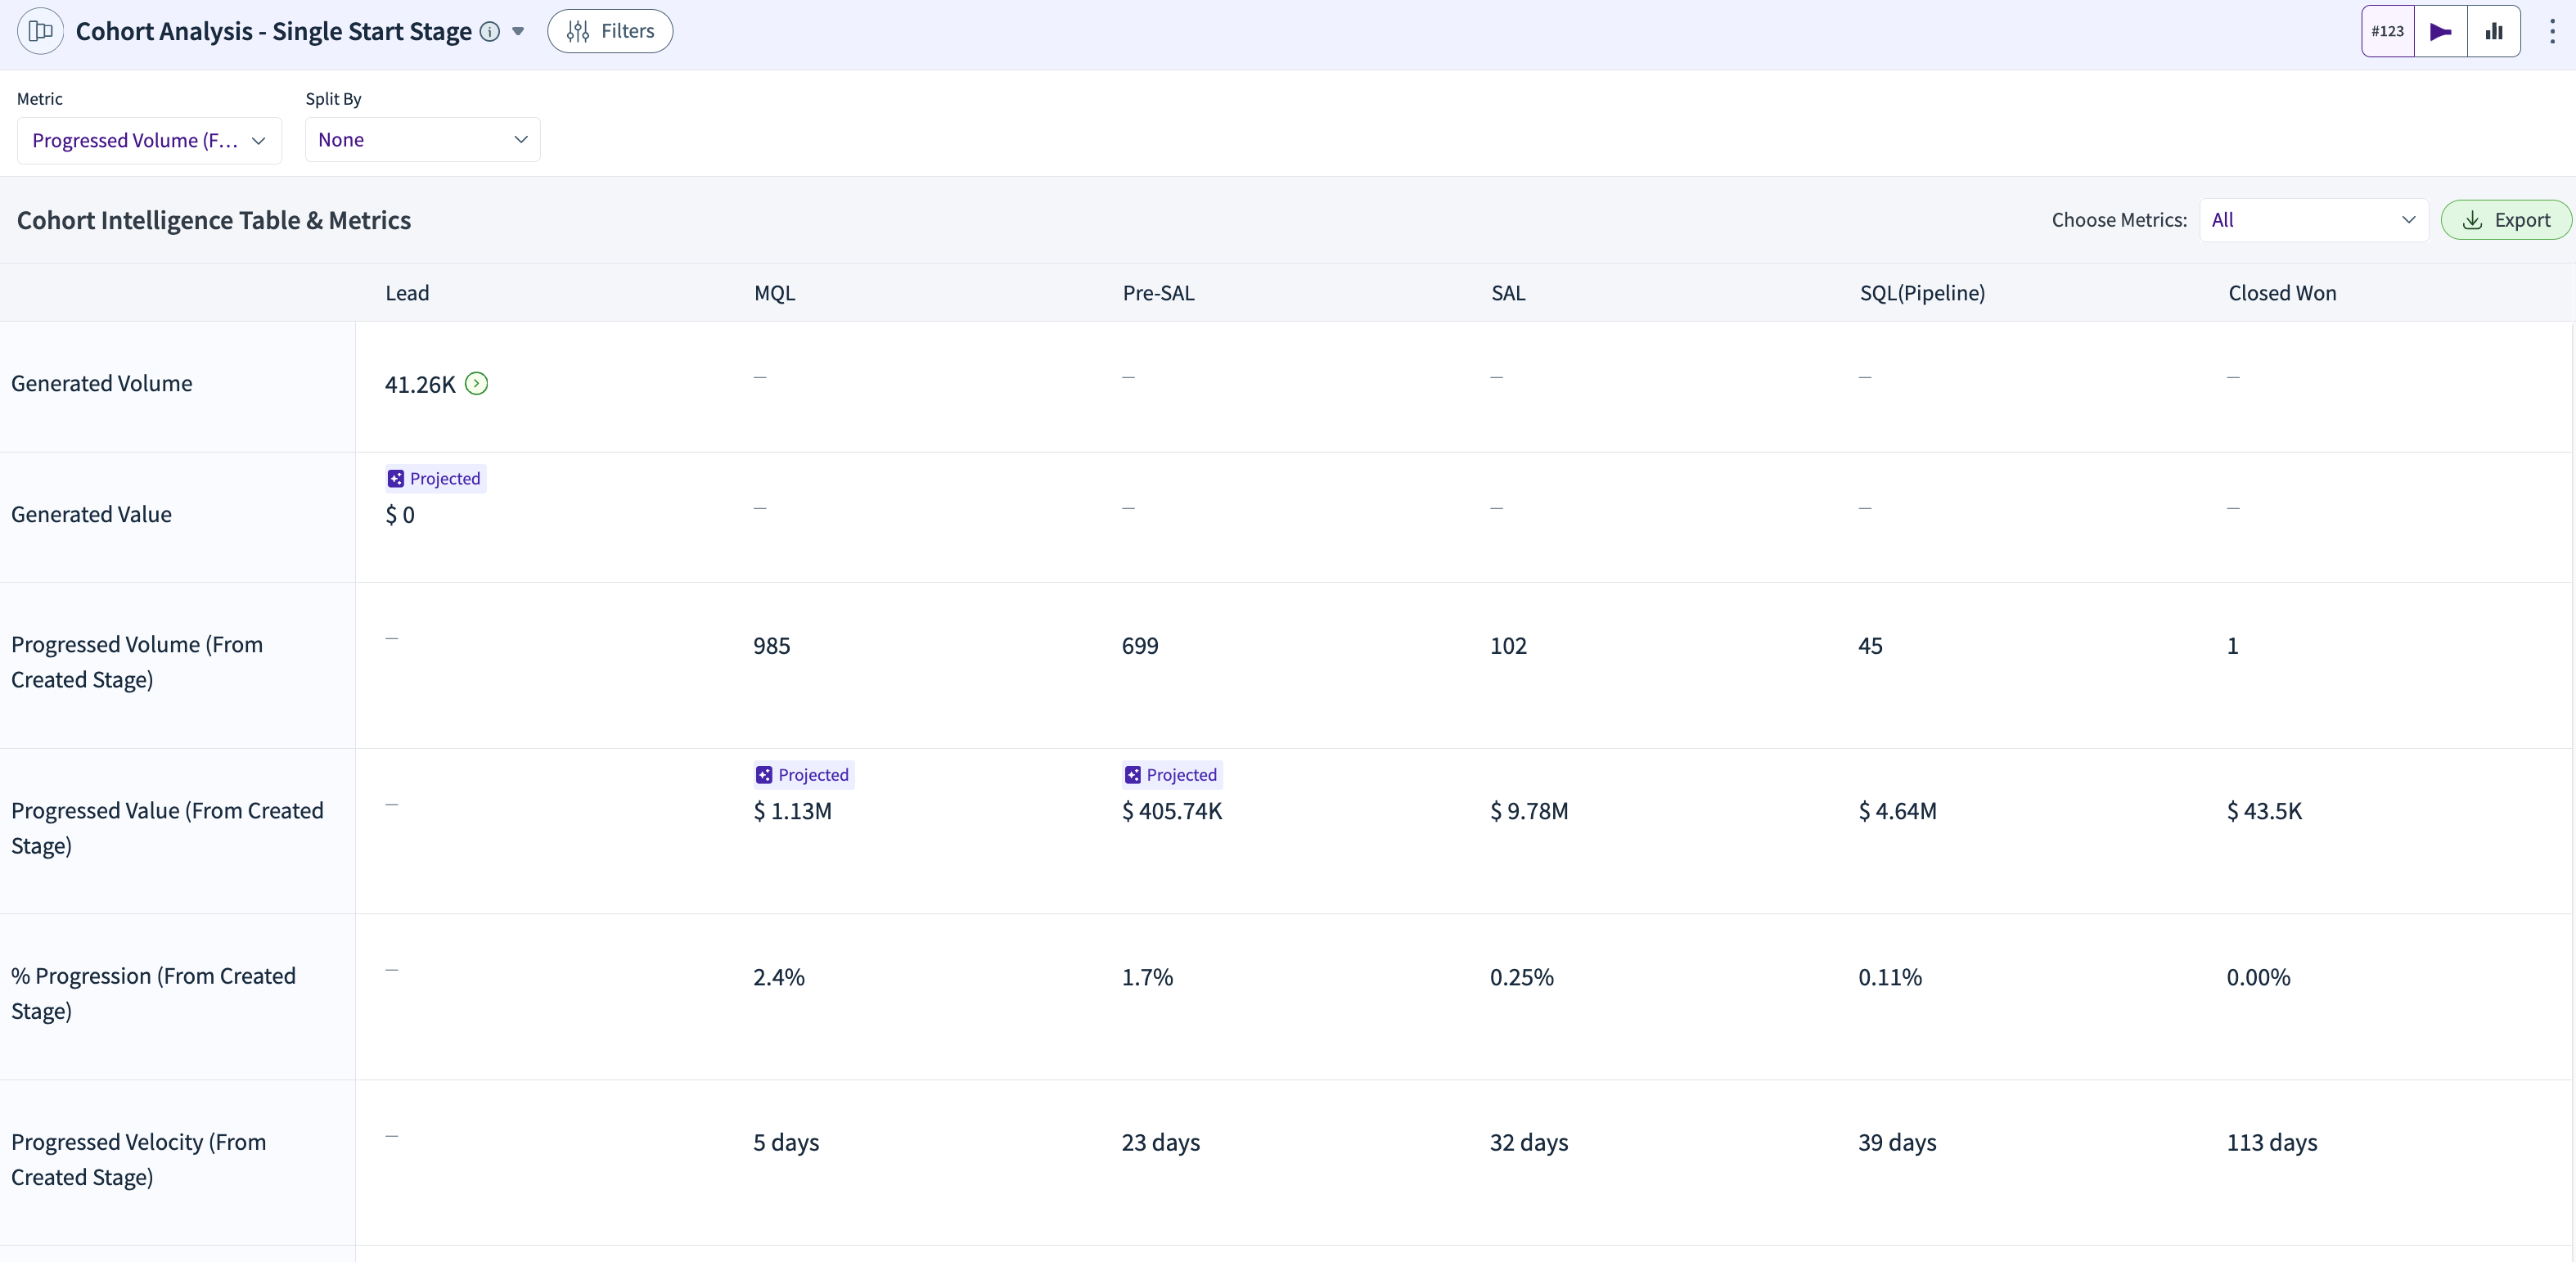
Tracks the progress of specific cohorts, such as leads entering the funnel in Q1, through stages like "Pre-Qualified Opportunity" and "Closed Won."
Account Engagement Trends
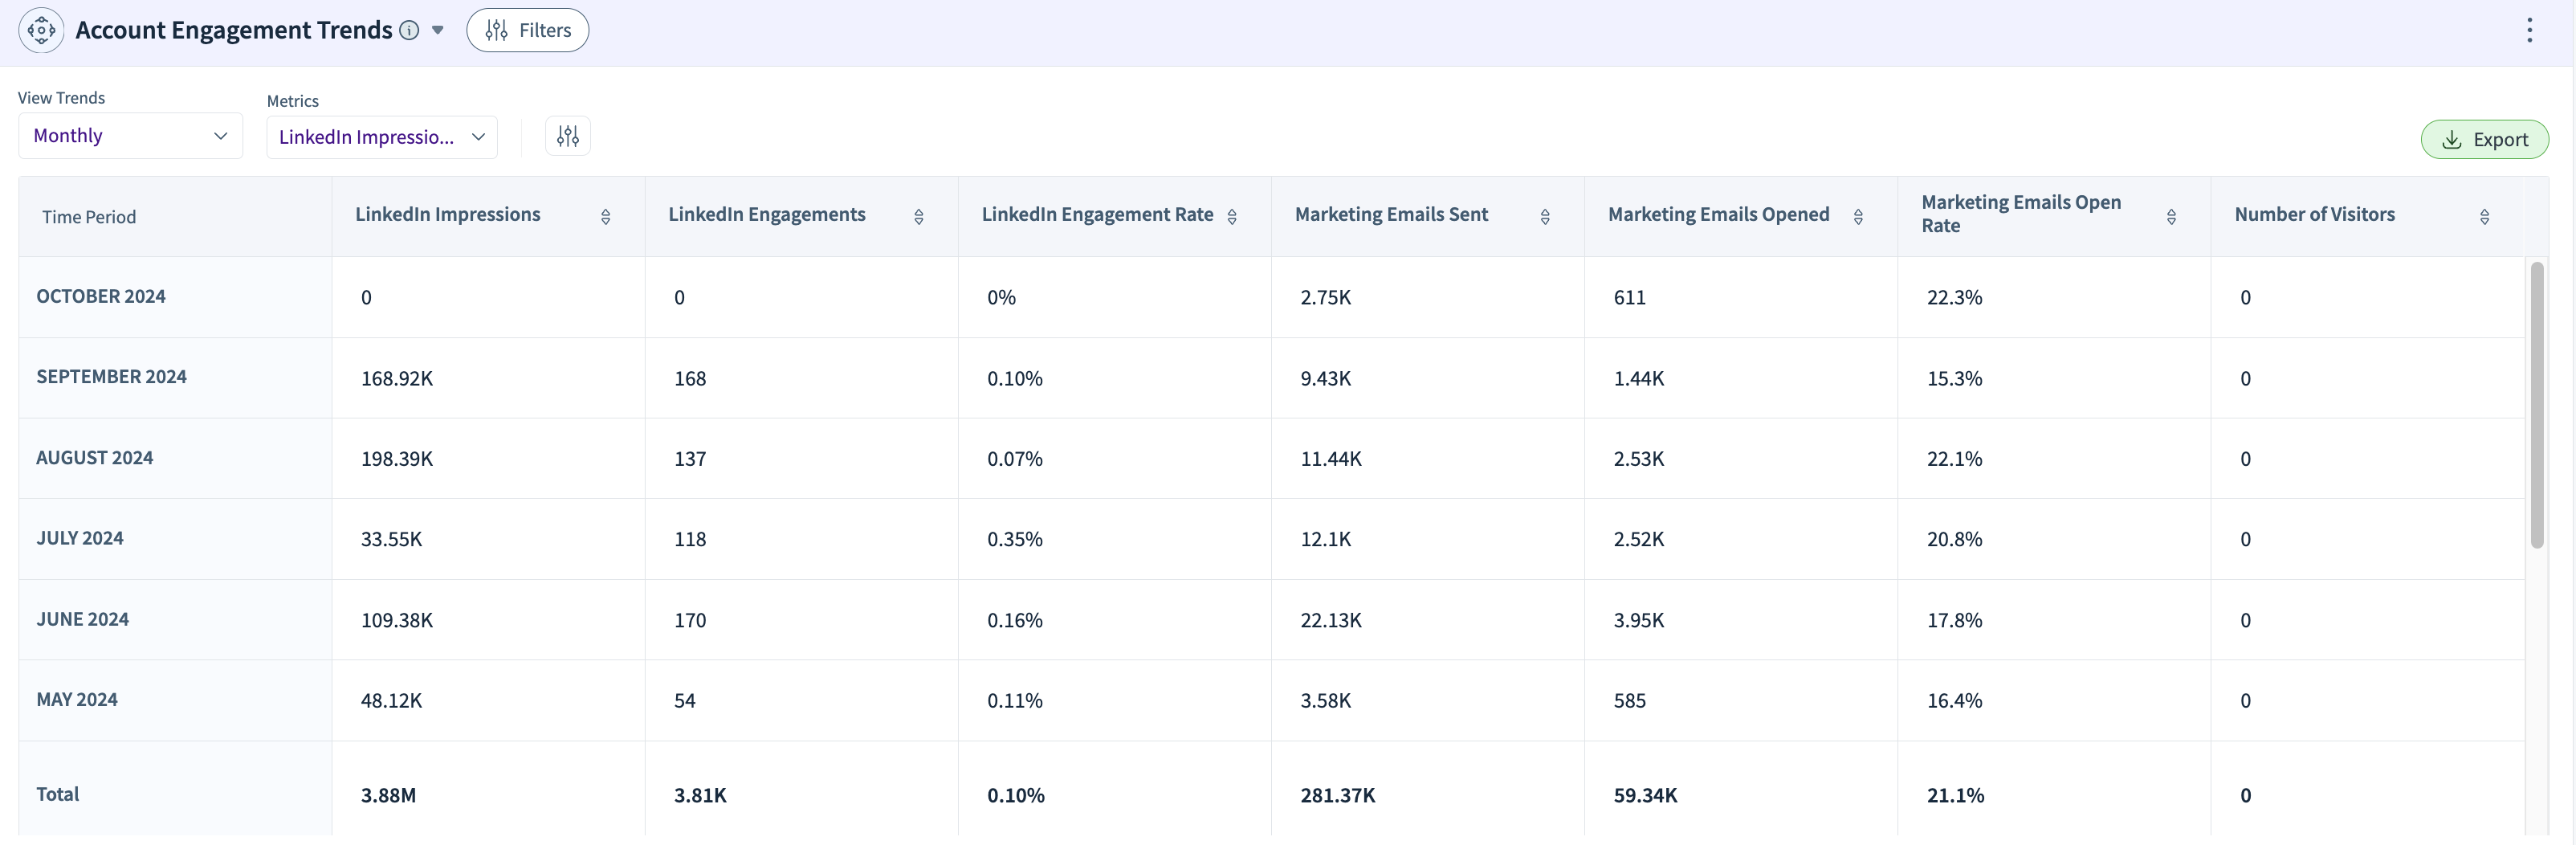
Tracks engagement metrics for specific accounts, such as LinkedIn impressions, email open rates, and interaction with marketing campaigns (e.g., 3.11K LinkedIn impressions in October).
Prioritization and Recommendations
Lead Prioritization
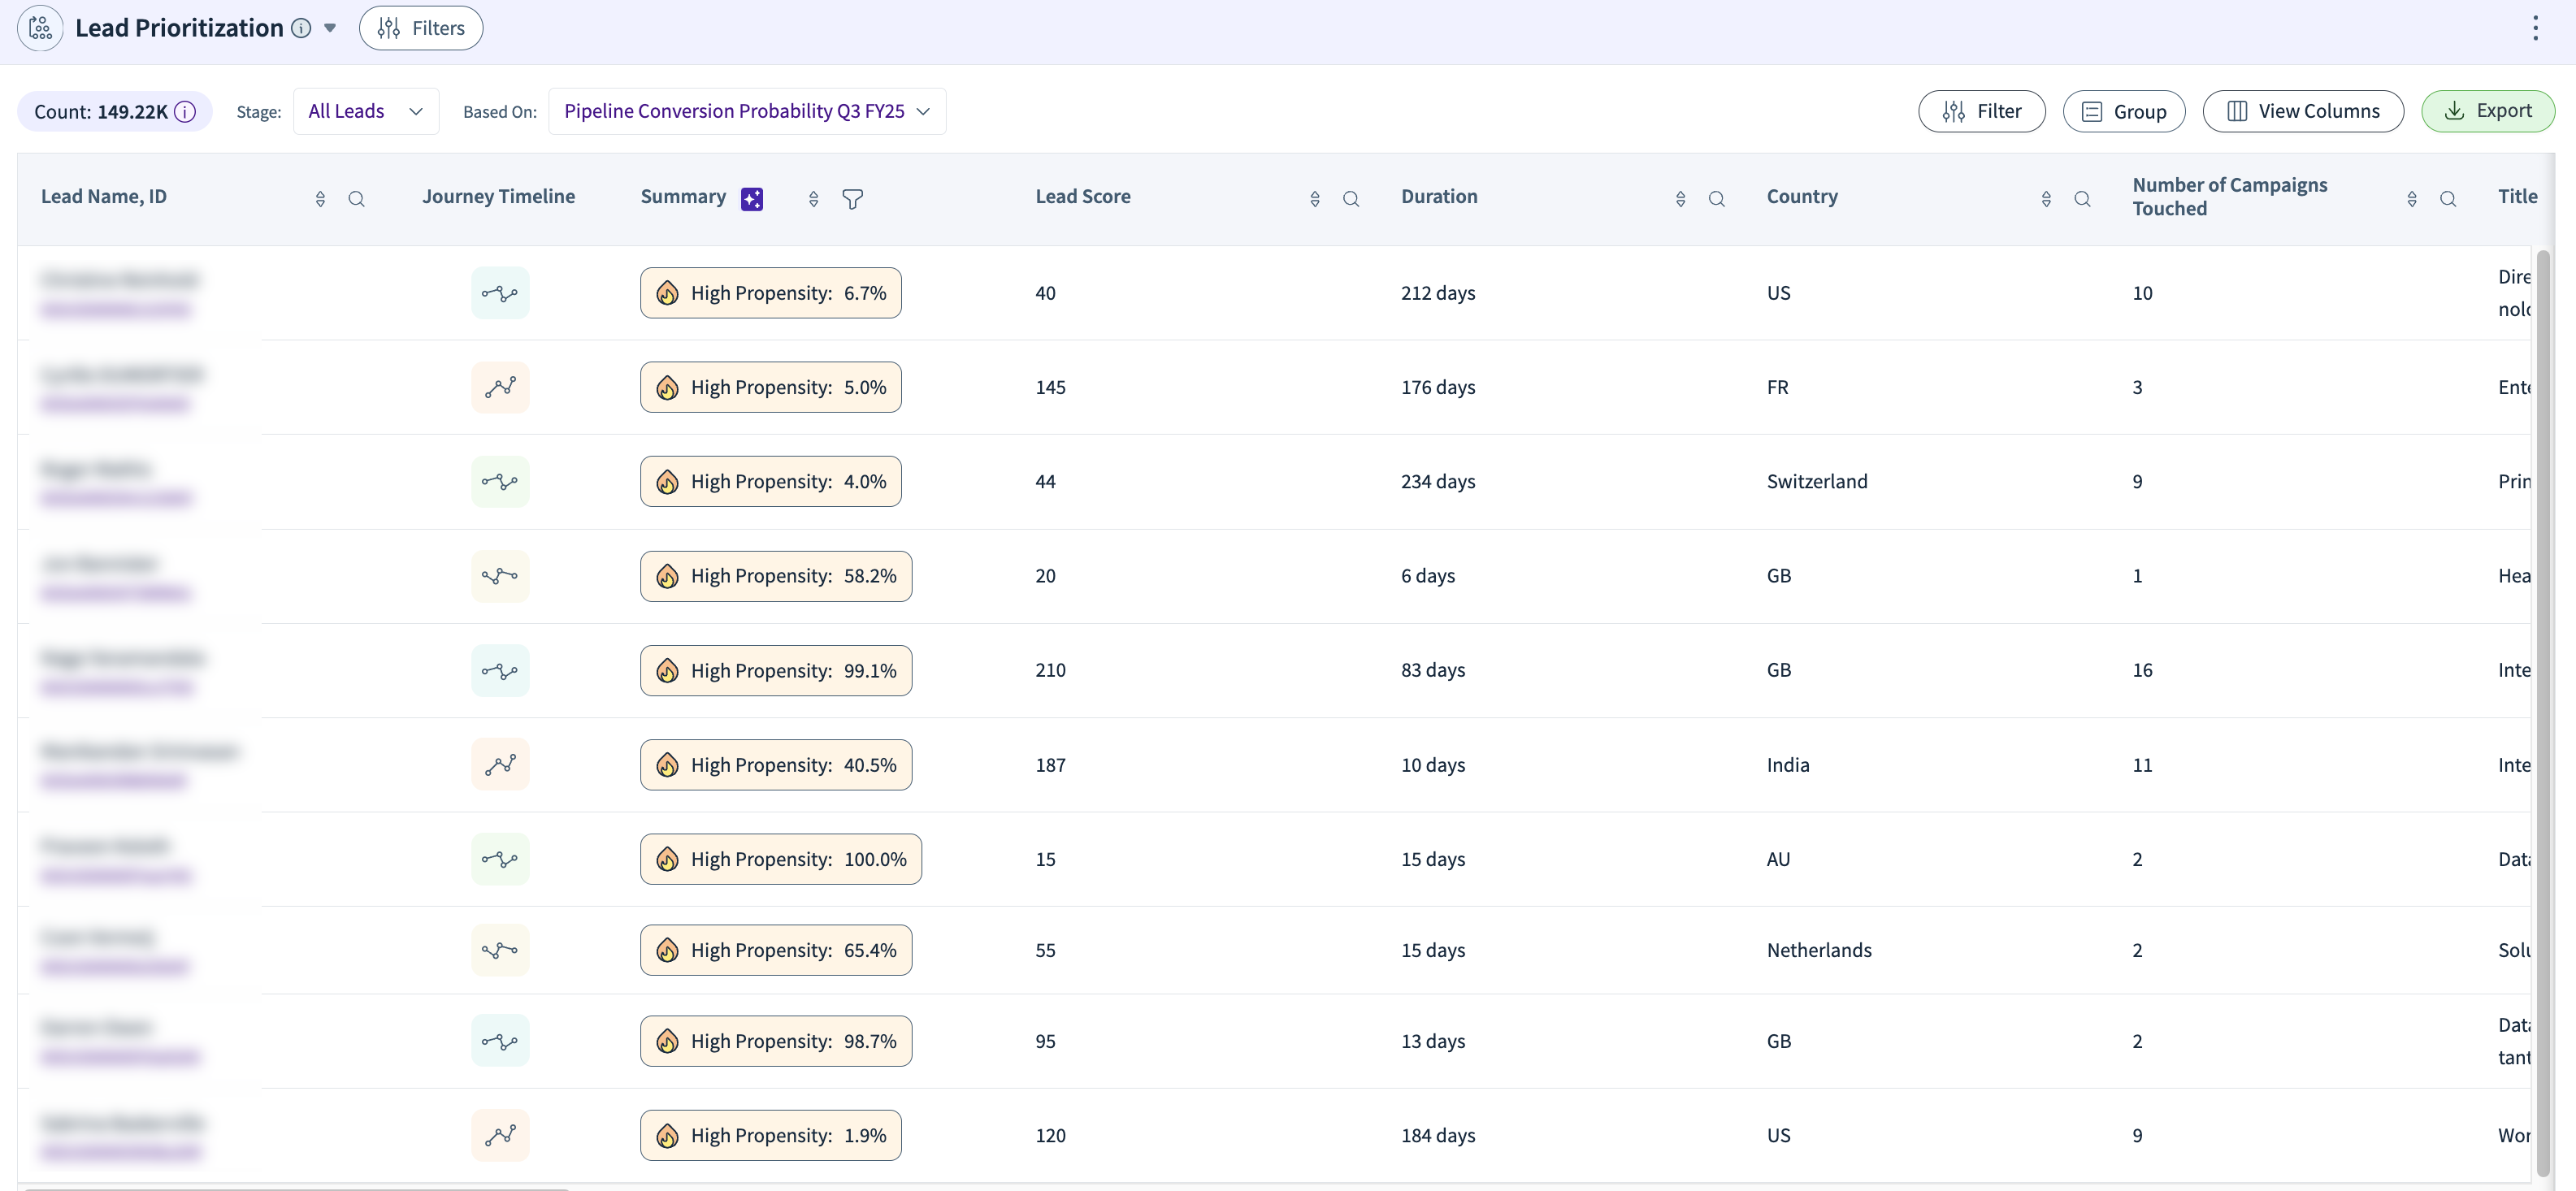
Identify and focus on leads most likely to convert by analyzing multiple engagement and demographic factors, helping you meet and exceed your pipeline and booking targets.
Opportunity Prioritization
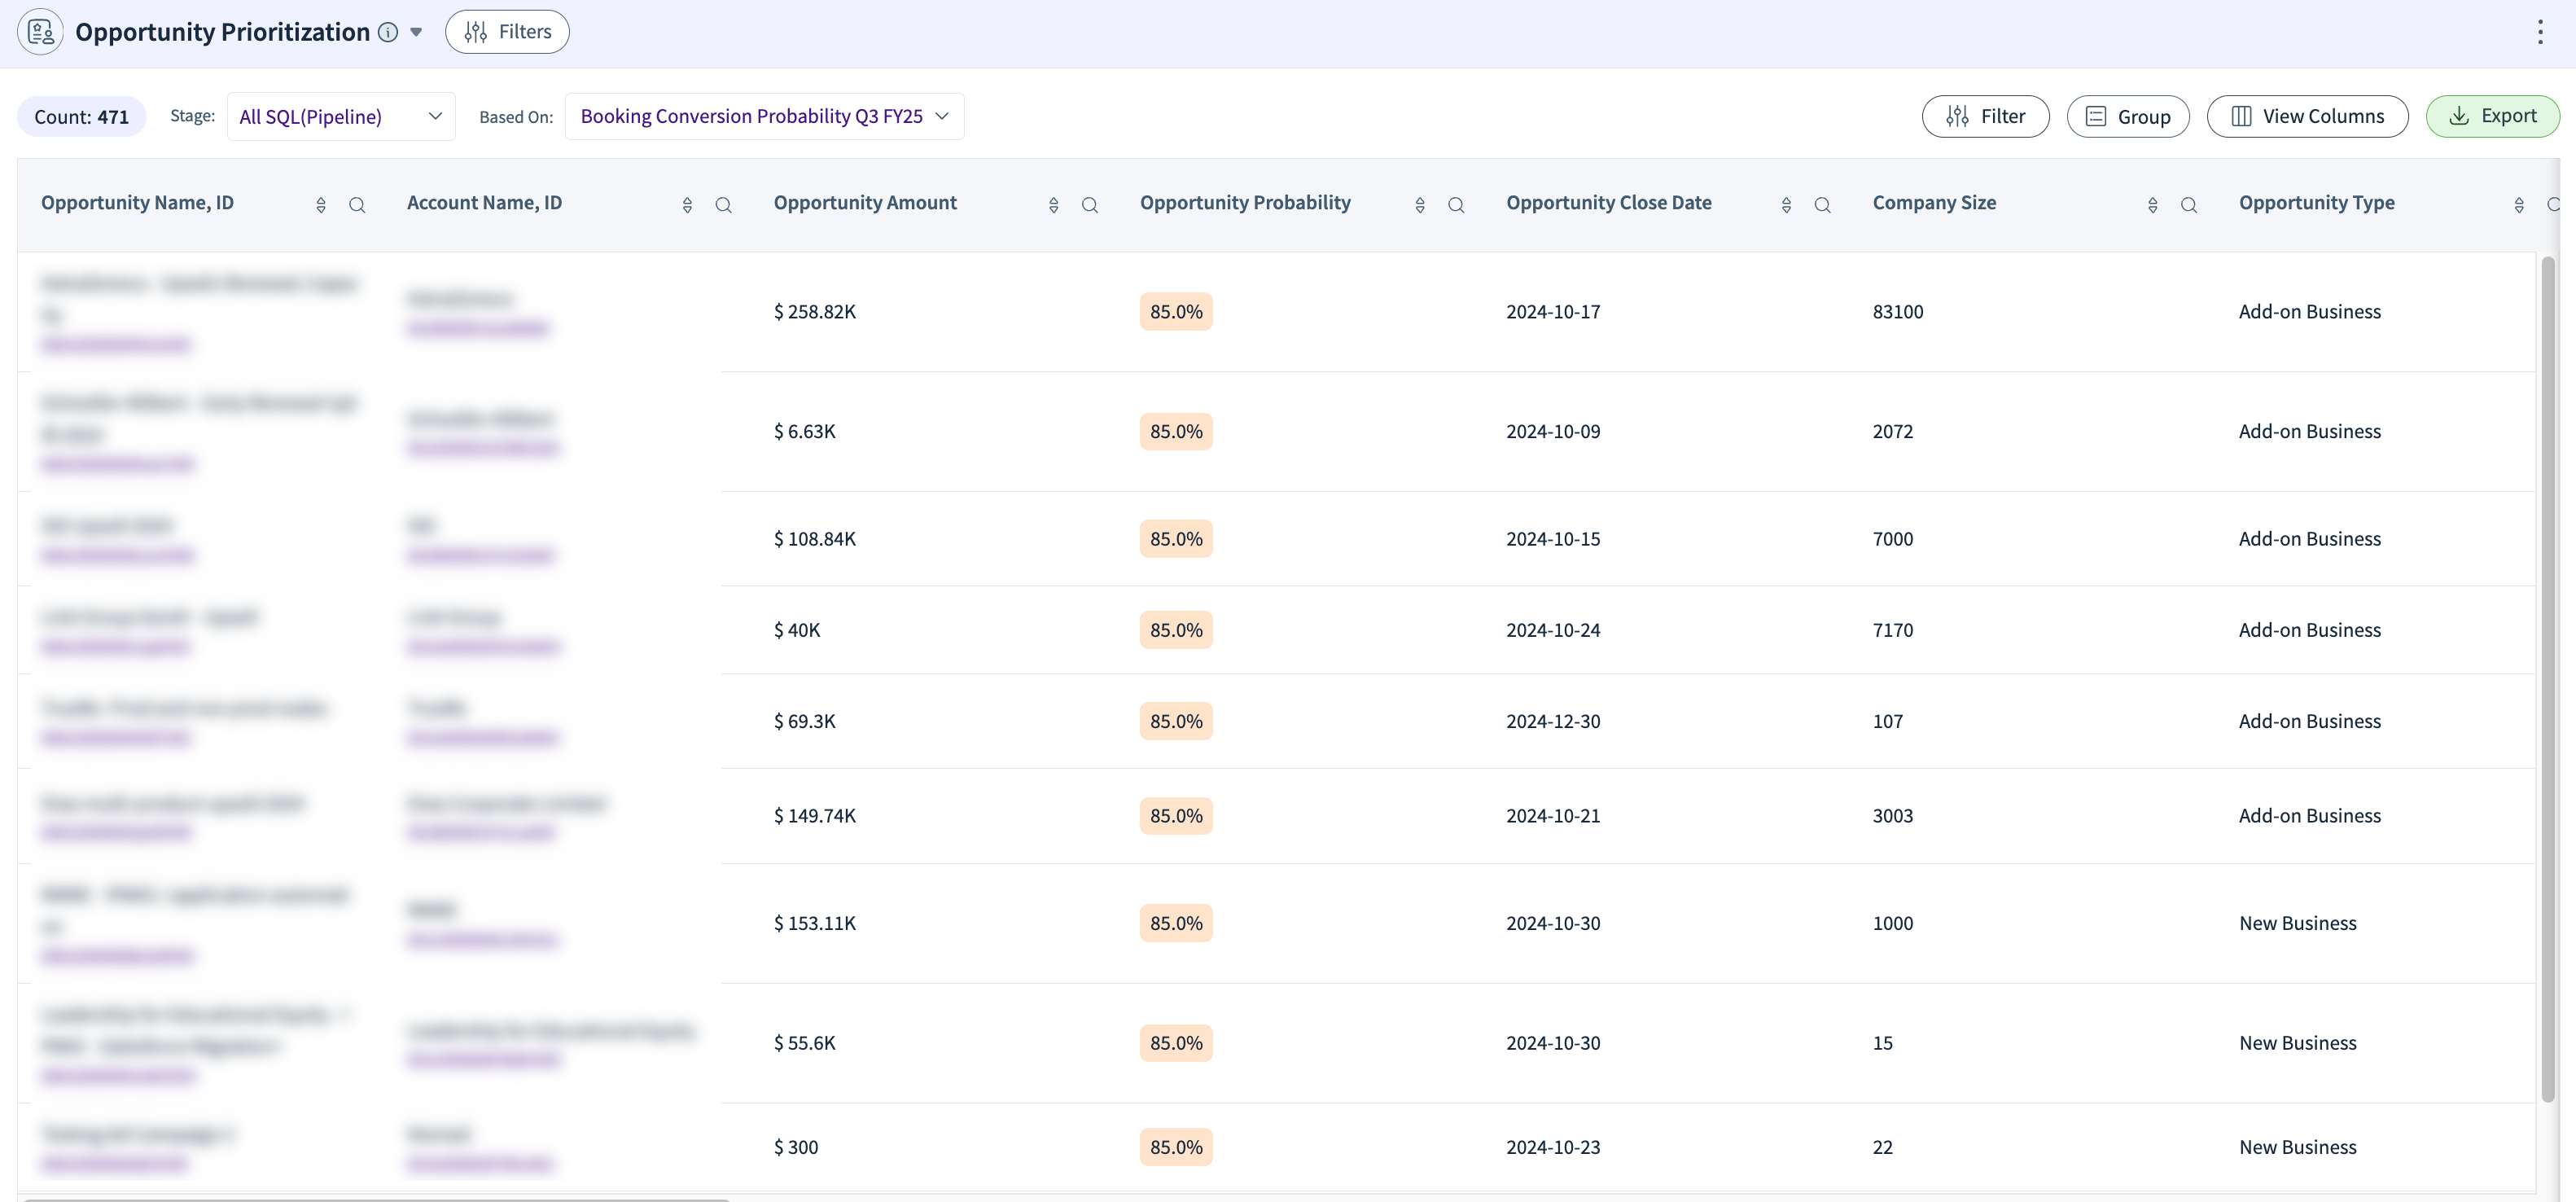
Determine which opportunities have the highest potential to close by evaluating key deal attributes, ensuring you achieve your pipeline and revenue goals.
Account Prioritization
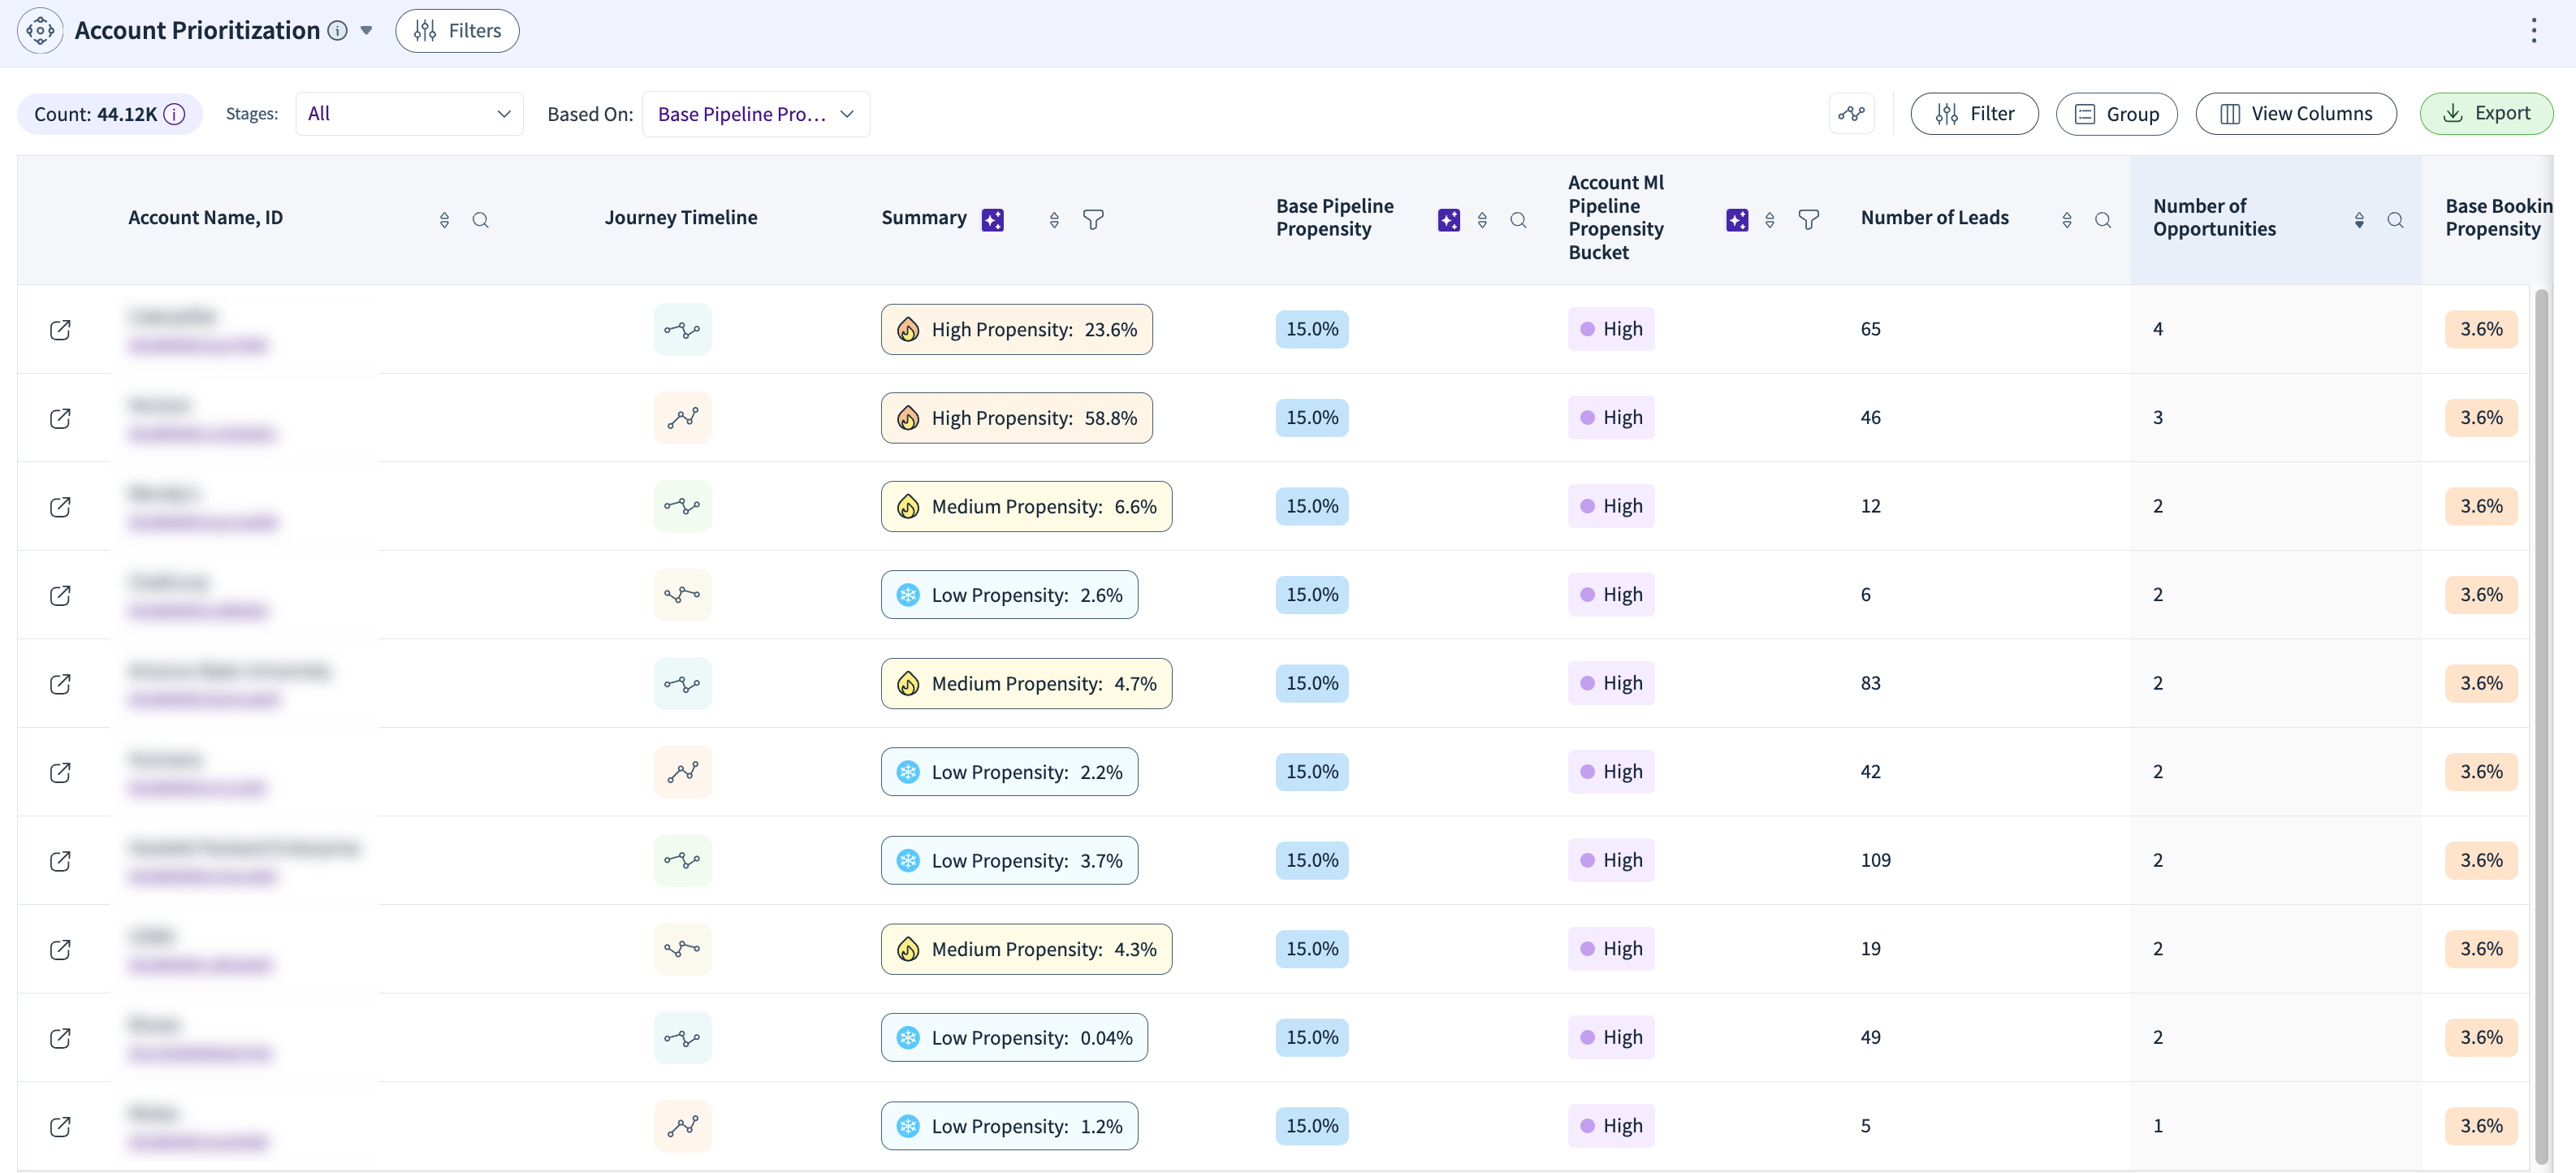
Prioritize accounts within your funnel by combining insights from engagement, behavior, and firmographic data, so you can concentrate your efforts on accounts most likely to convert.
Pipeline Analytics
Booking Trends by Quarter of Close
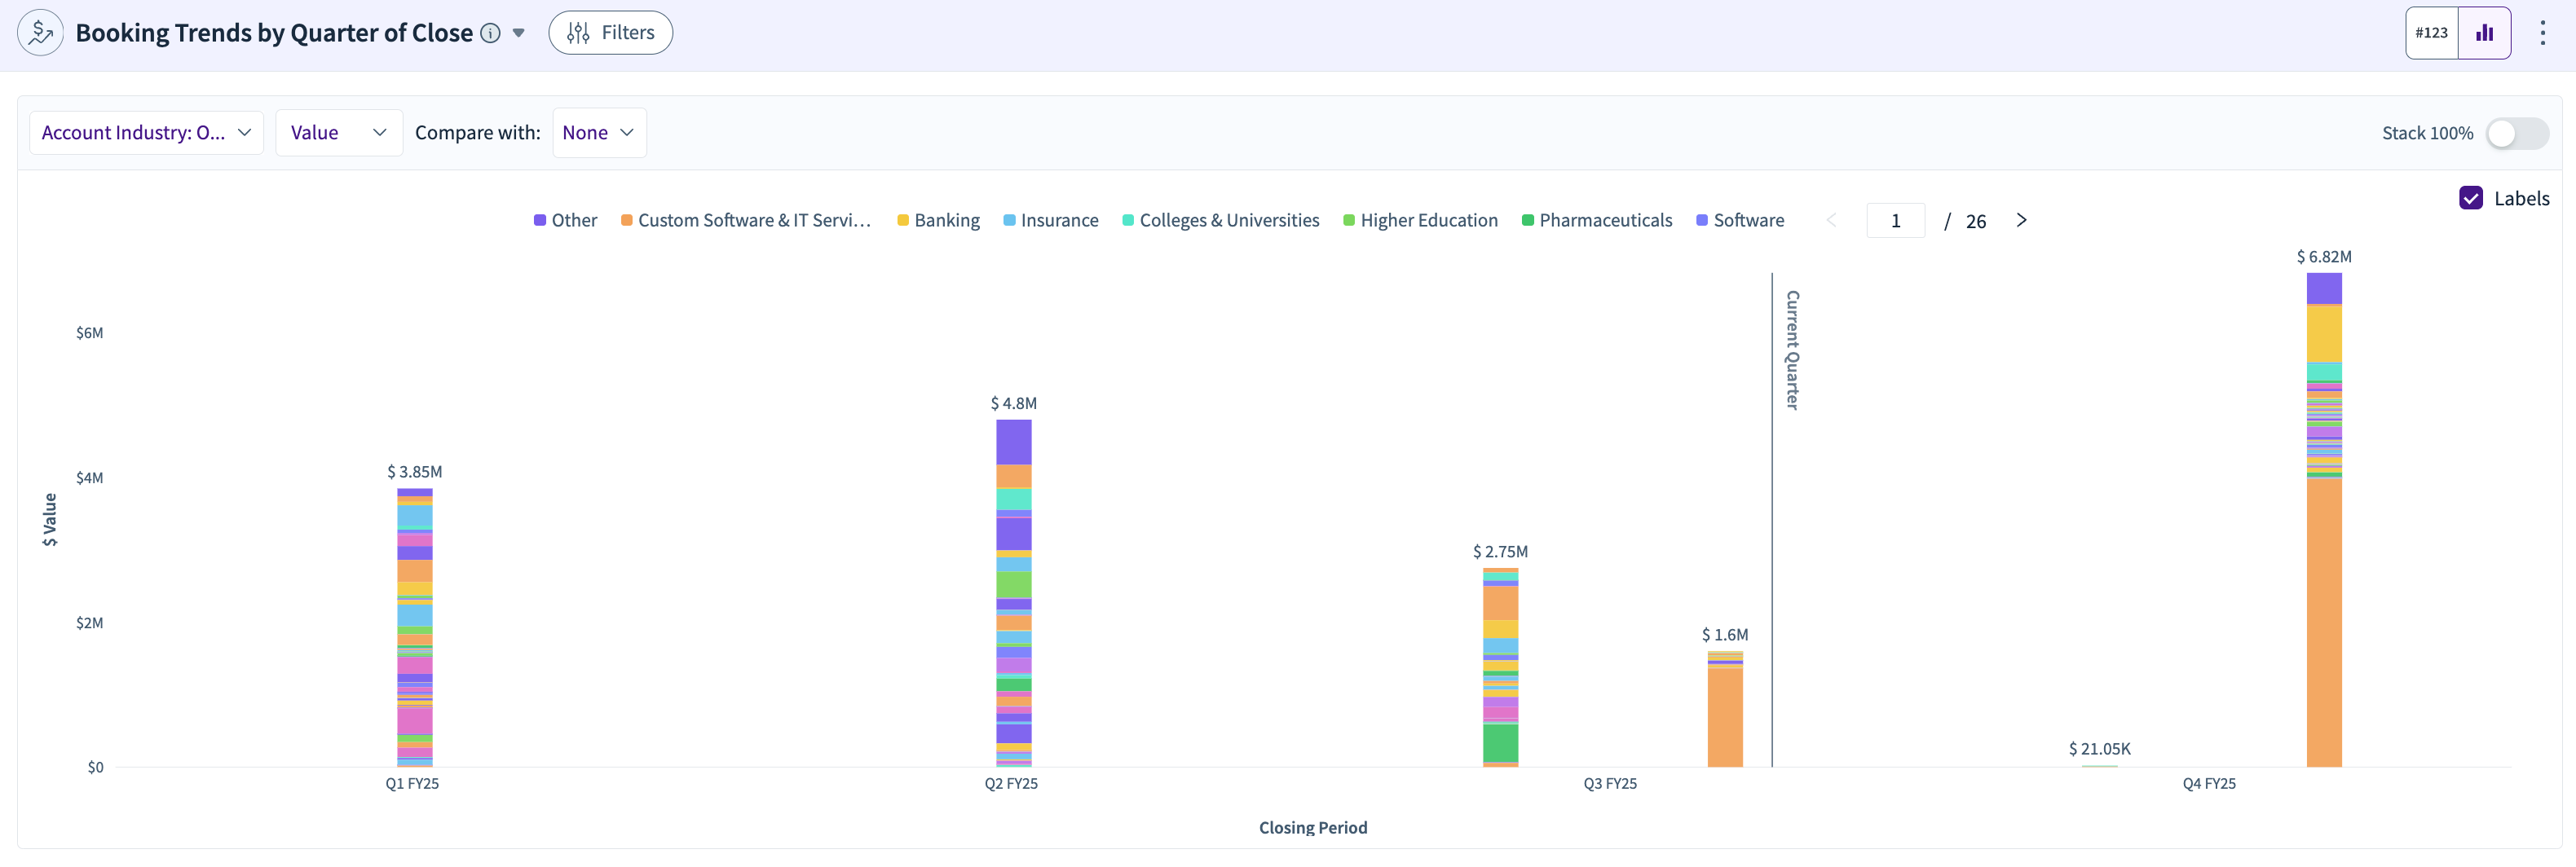
Shows the trend of actual and projected bookings for each quarter, tracking metrics like actual bookings and projections for Q3 FY25.
Walk-in Pipeline by Quarter of Close
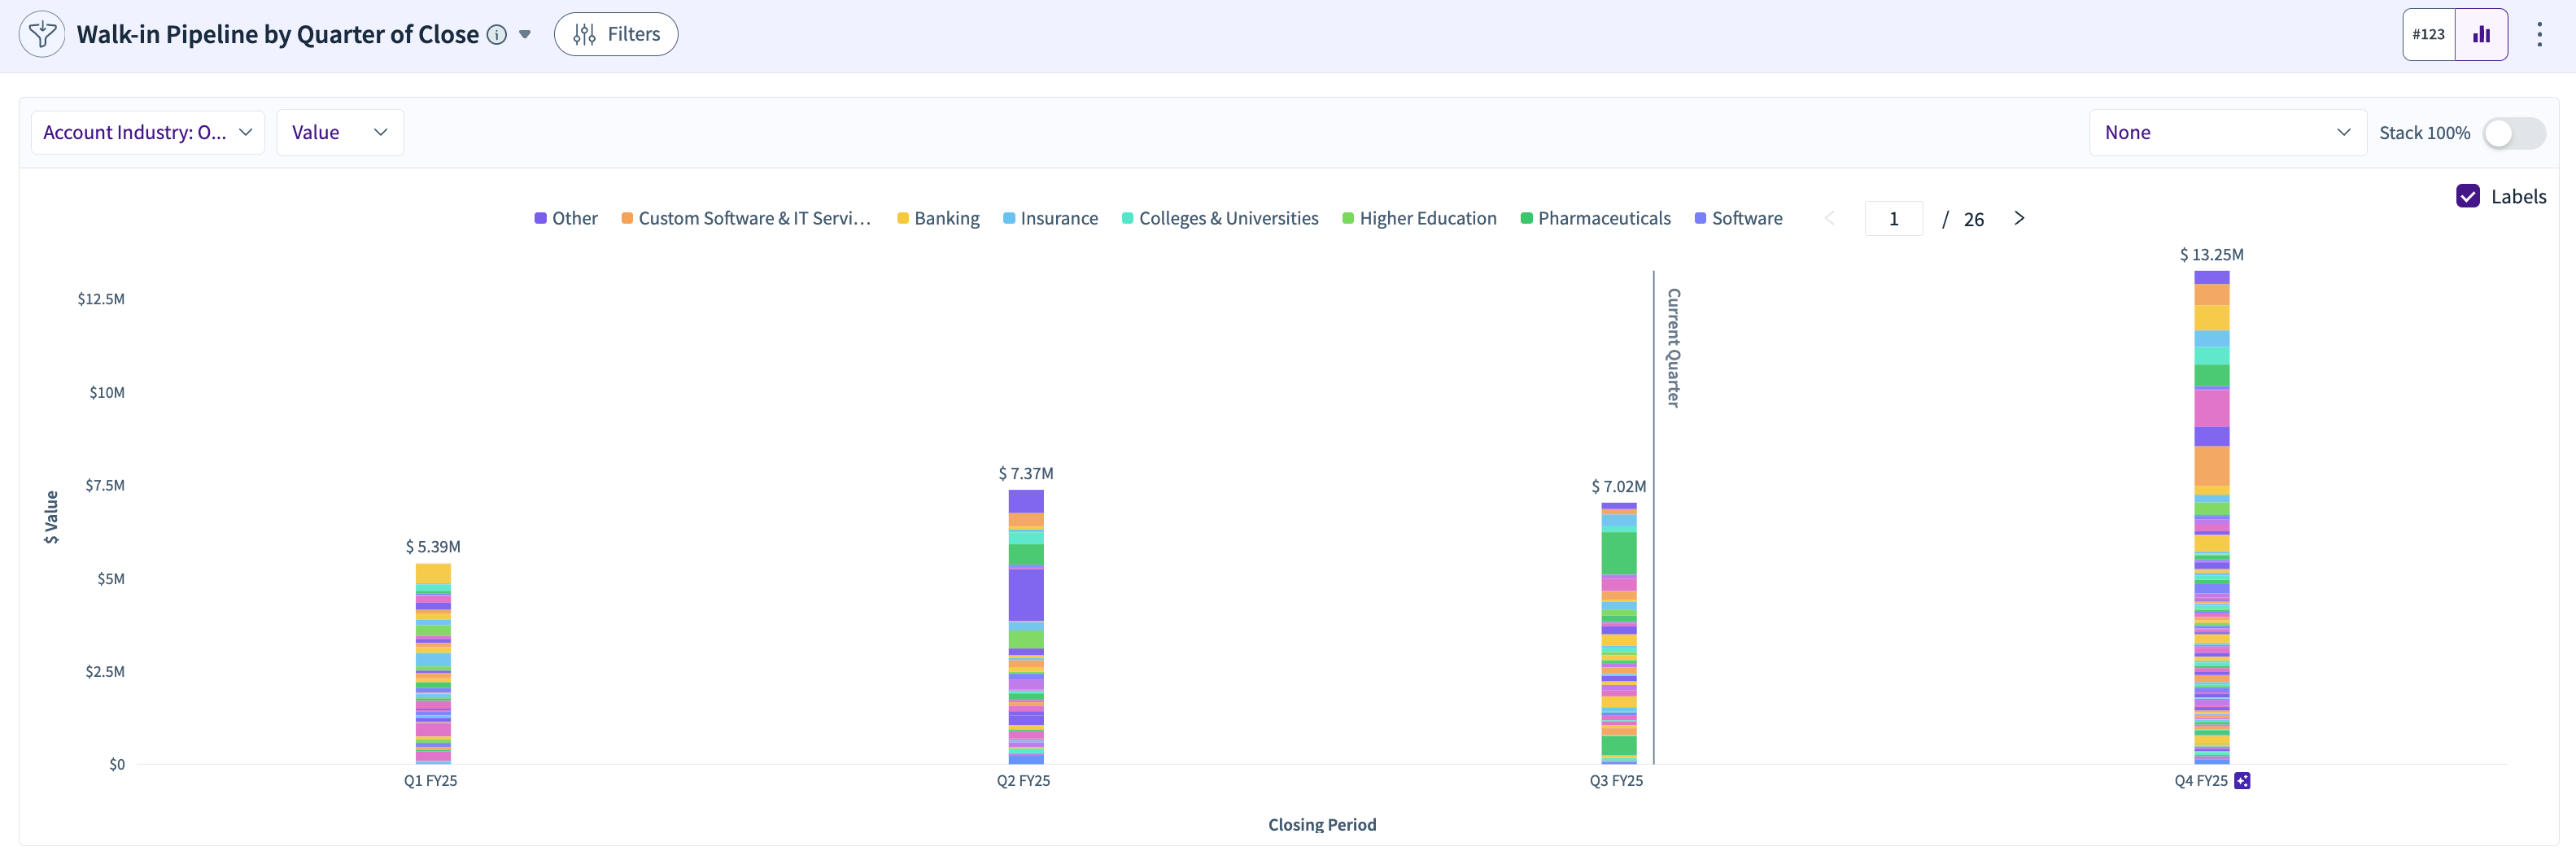
Displays the day 1 pipeline value of each quarter, and tracks the pipeline that's expected to close within the same quarter.
Win Rate Trends by Quarter of Close
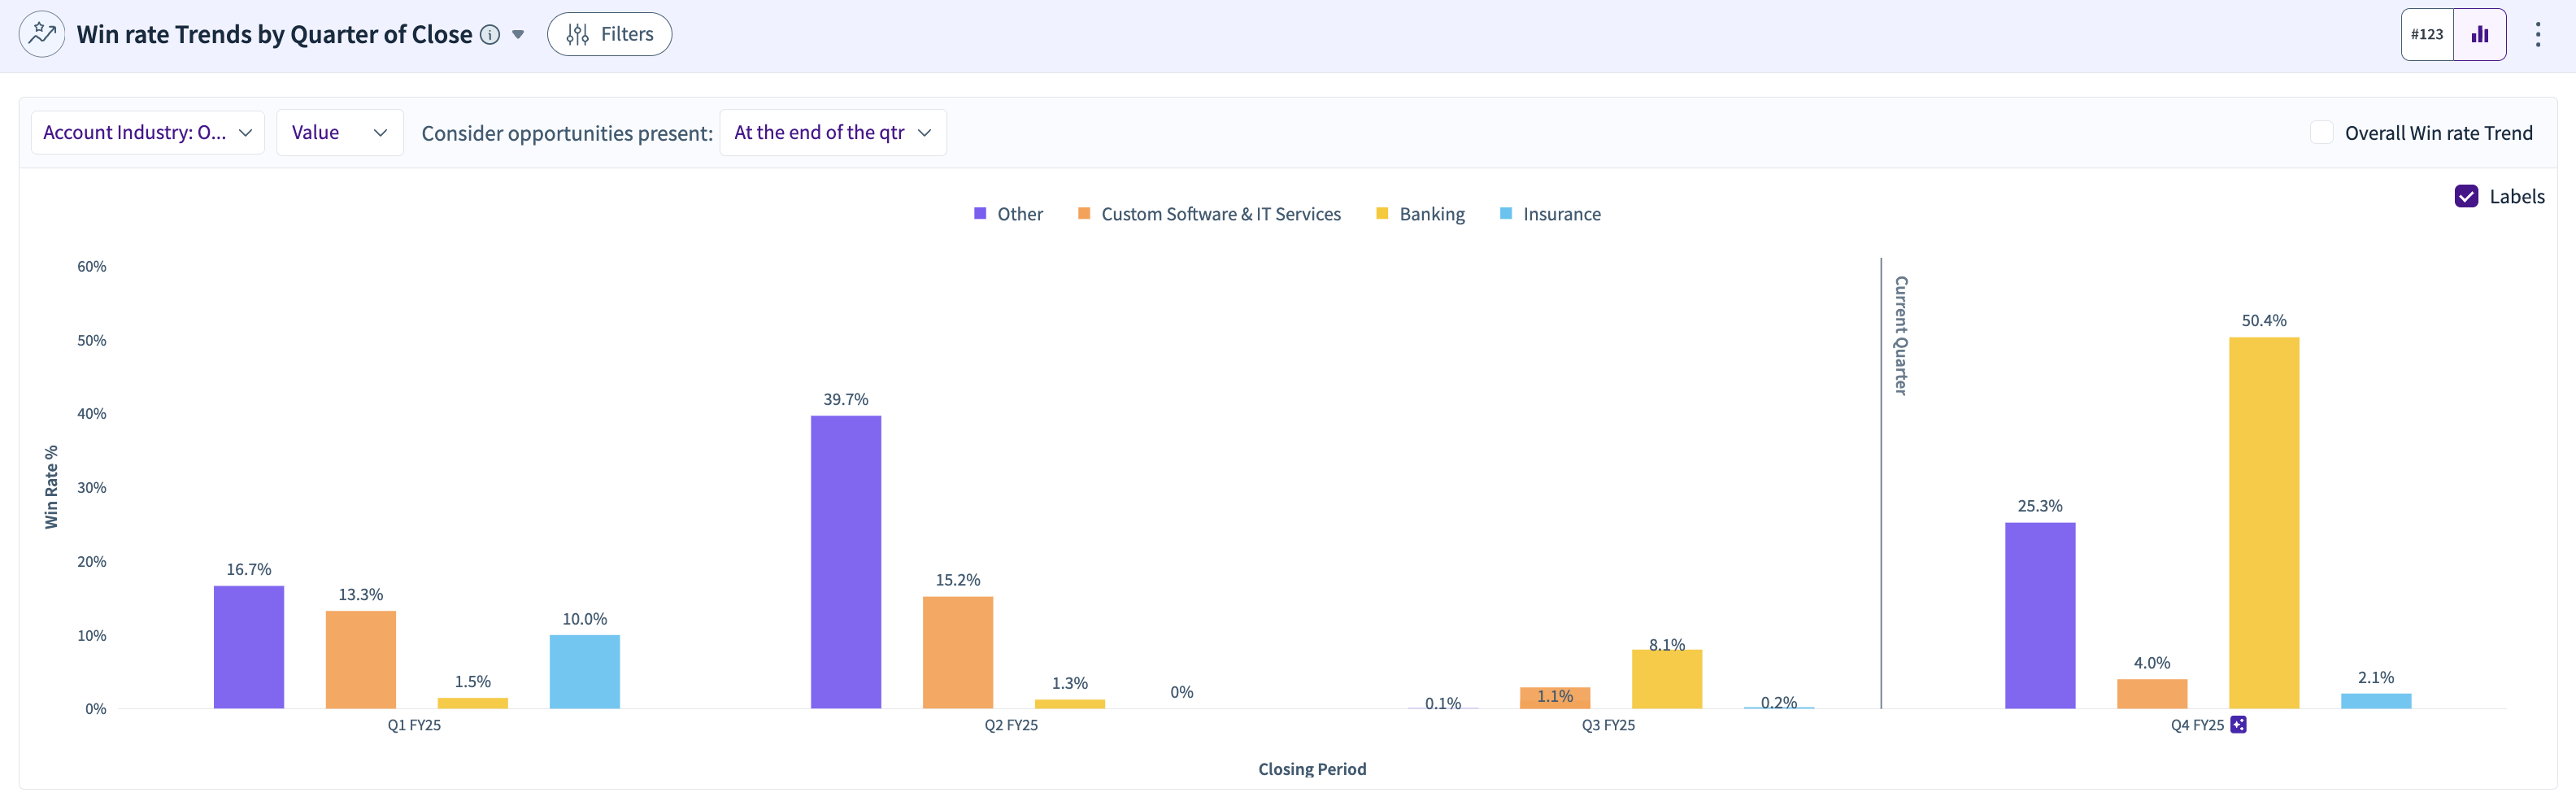
Tracks actual and projected win rates for opportunities closing in the quarter. E.g., a 4.7% win rate for Q3 FY25 and 5.4% for Q4 FY25.
Pipeline Snapshot
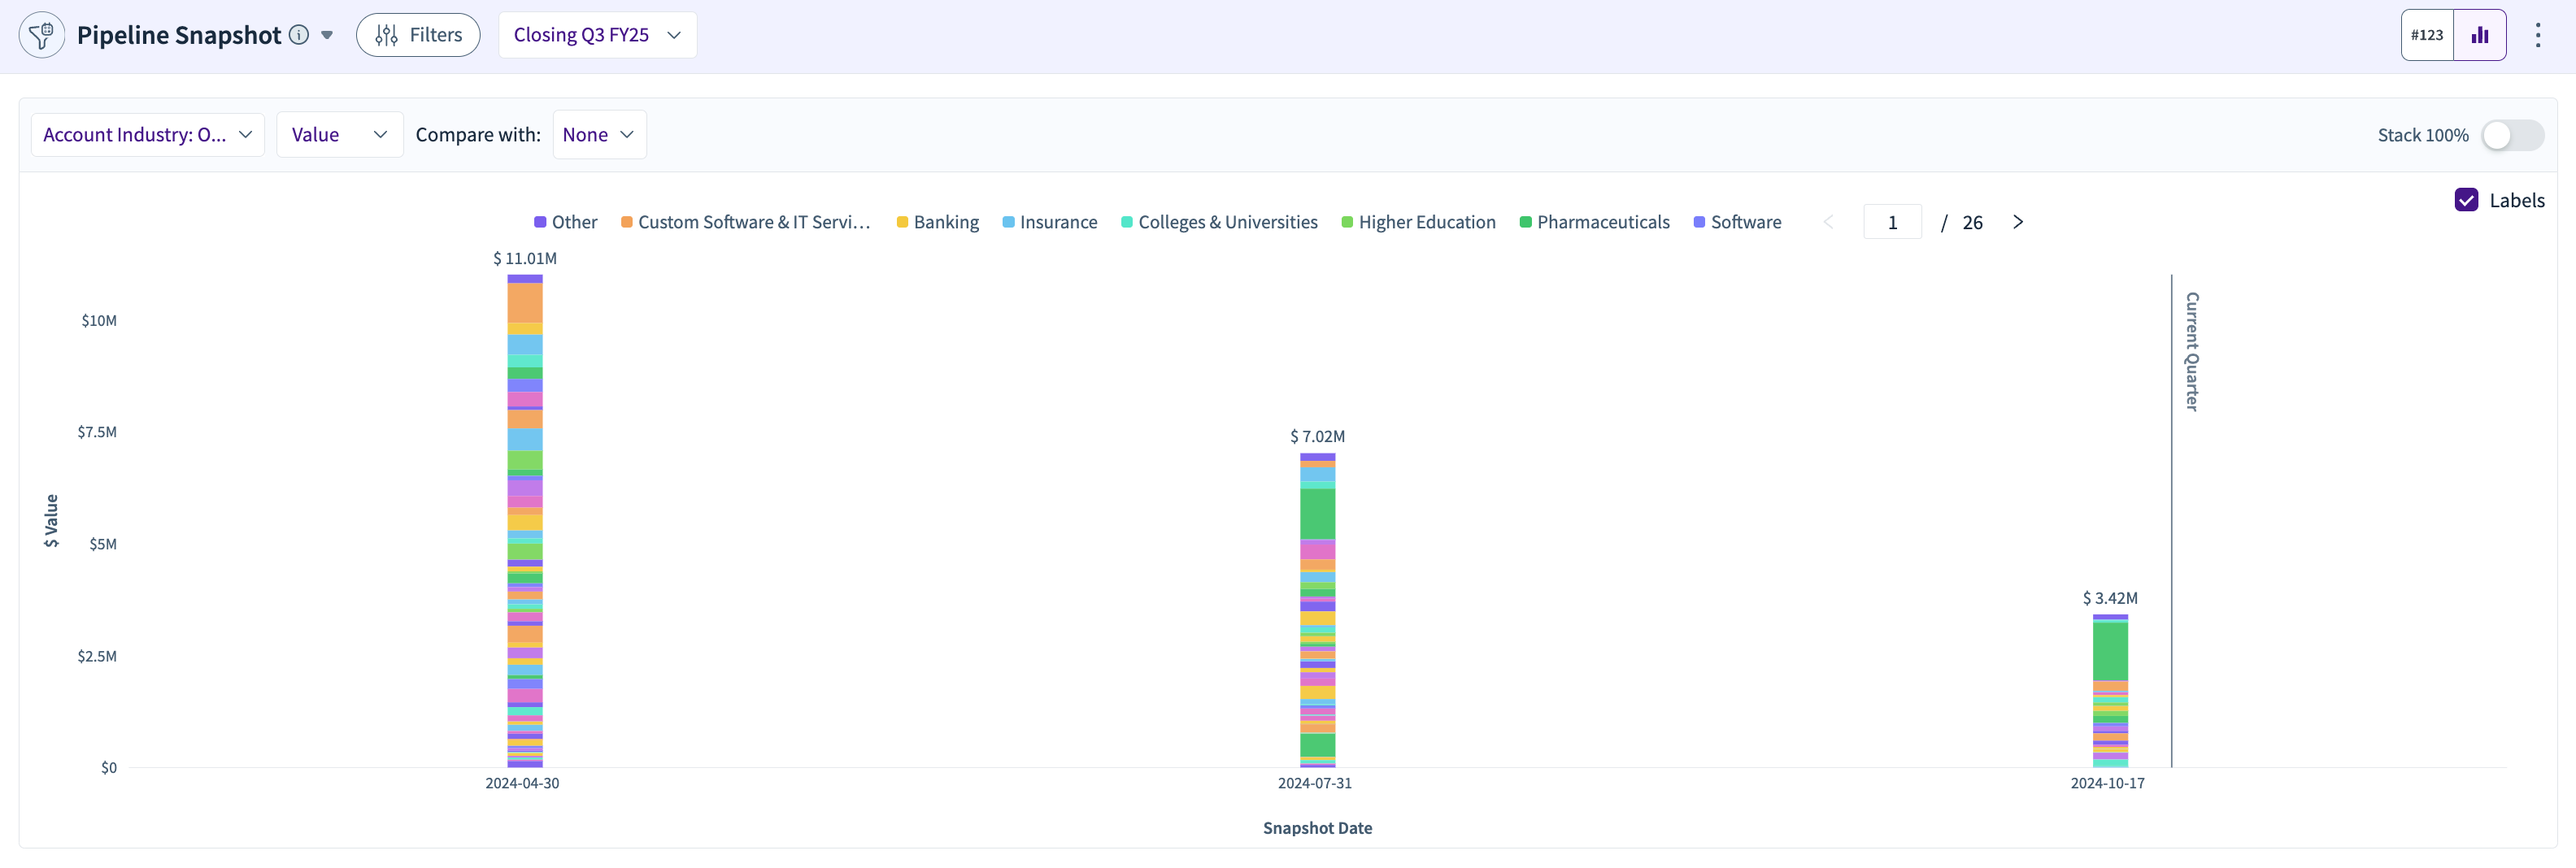
Provides a snapshot of the open pipeline at the end of each quarter, for example, $38.23 M at the end of Q3 FY25.
Pipeline Generation Trend
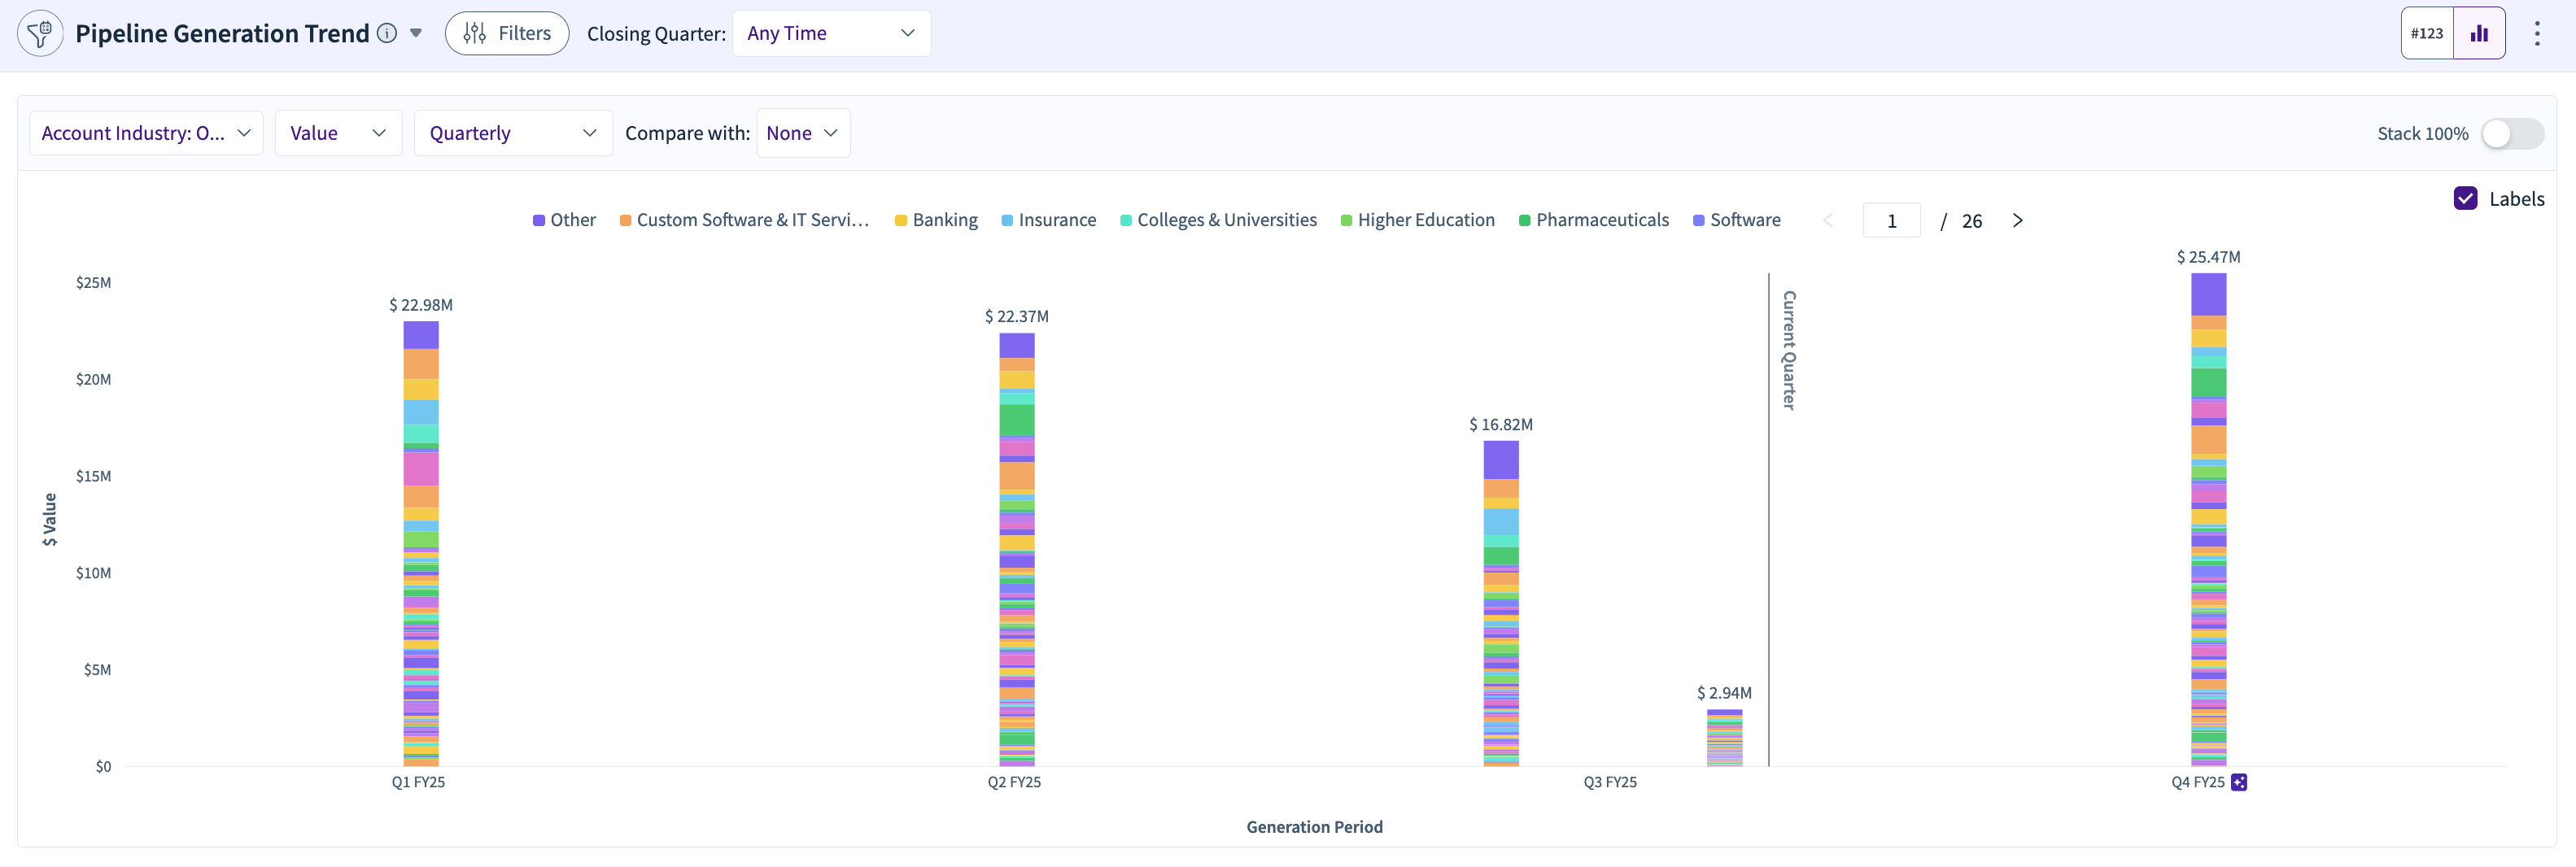
Shows the trend of actual and projected pipeline generation per quarter, for example, $48.22 M actual and $27.37 M projected pipeline generation for Q3 FY25.
Projected Pipeline by Projected Closing Quarter
Projects closing quarters for the pipeline you are expected to generate, helping anticipate the timing of future pipeline closures.
Projection Tracking
![]()
Tracks trends in the pipeline and booking projections across different quarters, monitoring shifts in forecasted outcomes.
Pipeline Movements
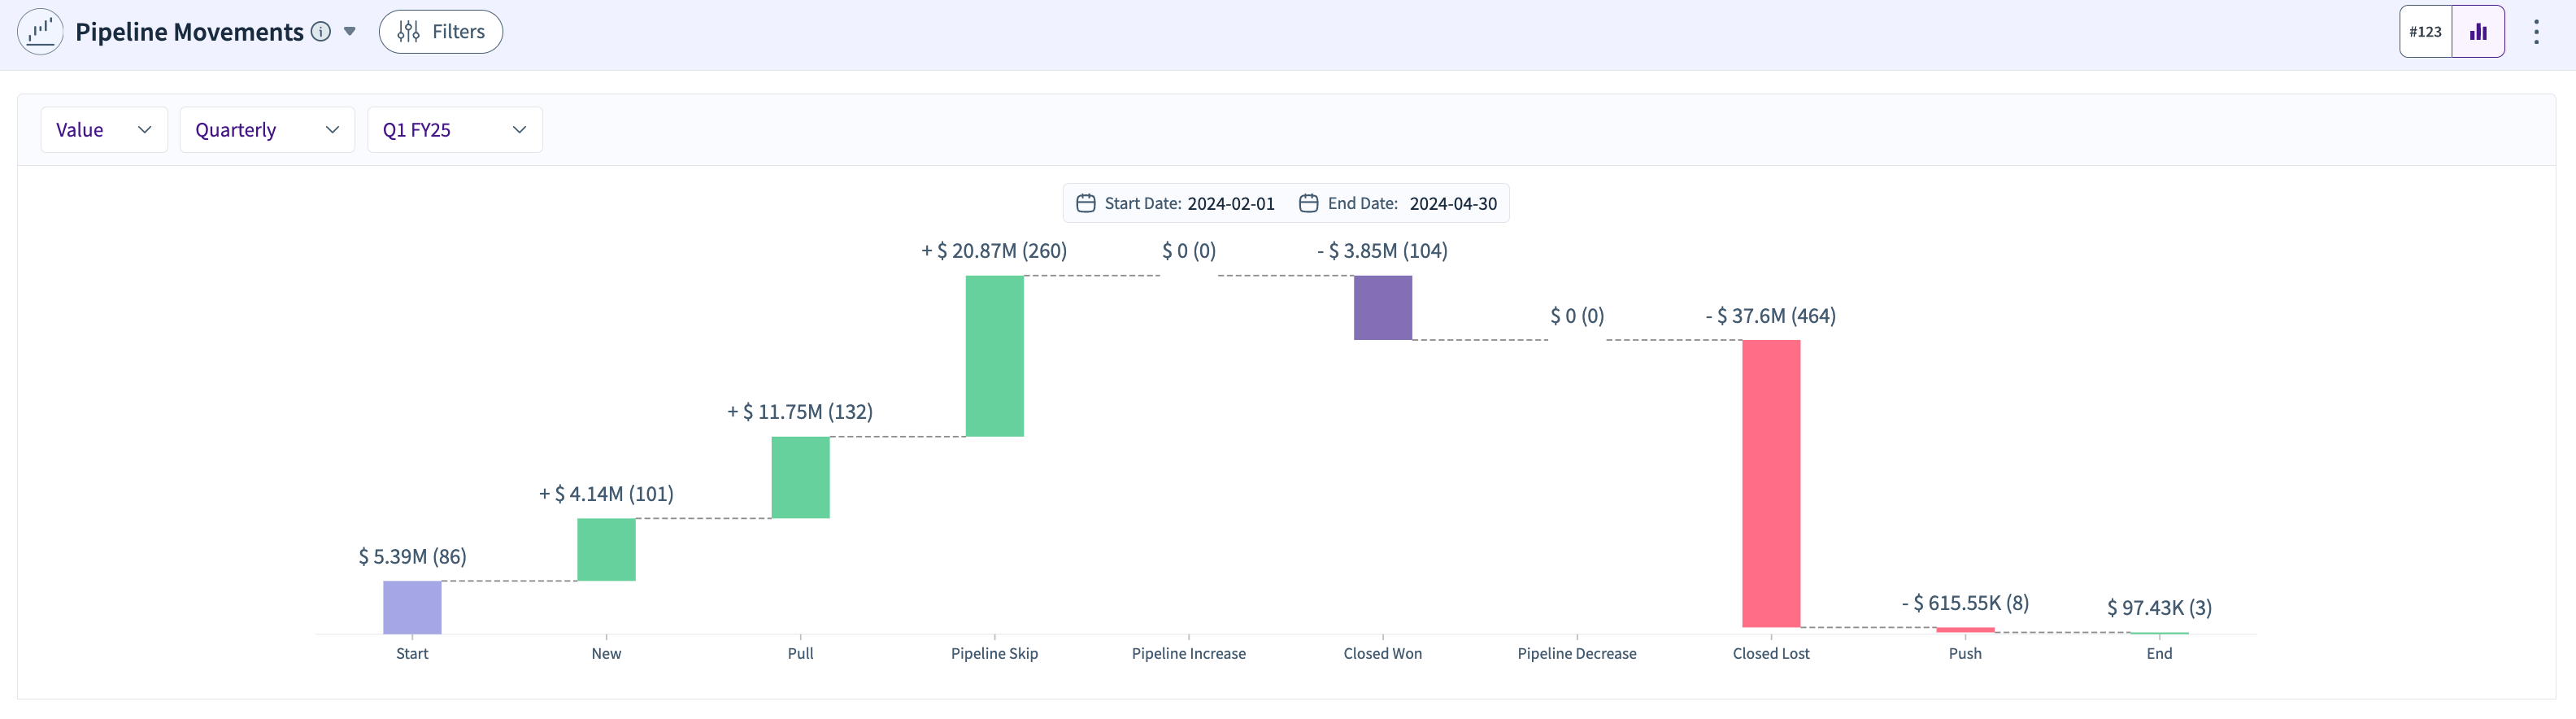
Summarizes all movements in the pipeline within a quarter, such as new additions, pipeline increase, and closed losses in Q1 FY25.
Pipeline Stage to Stage Progression
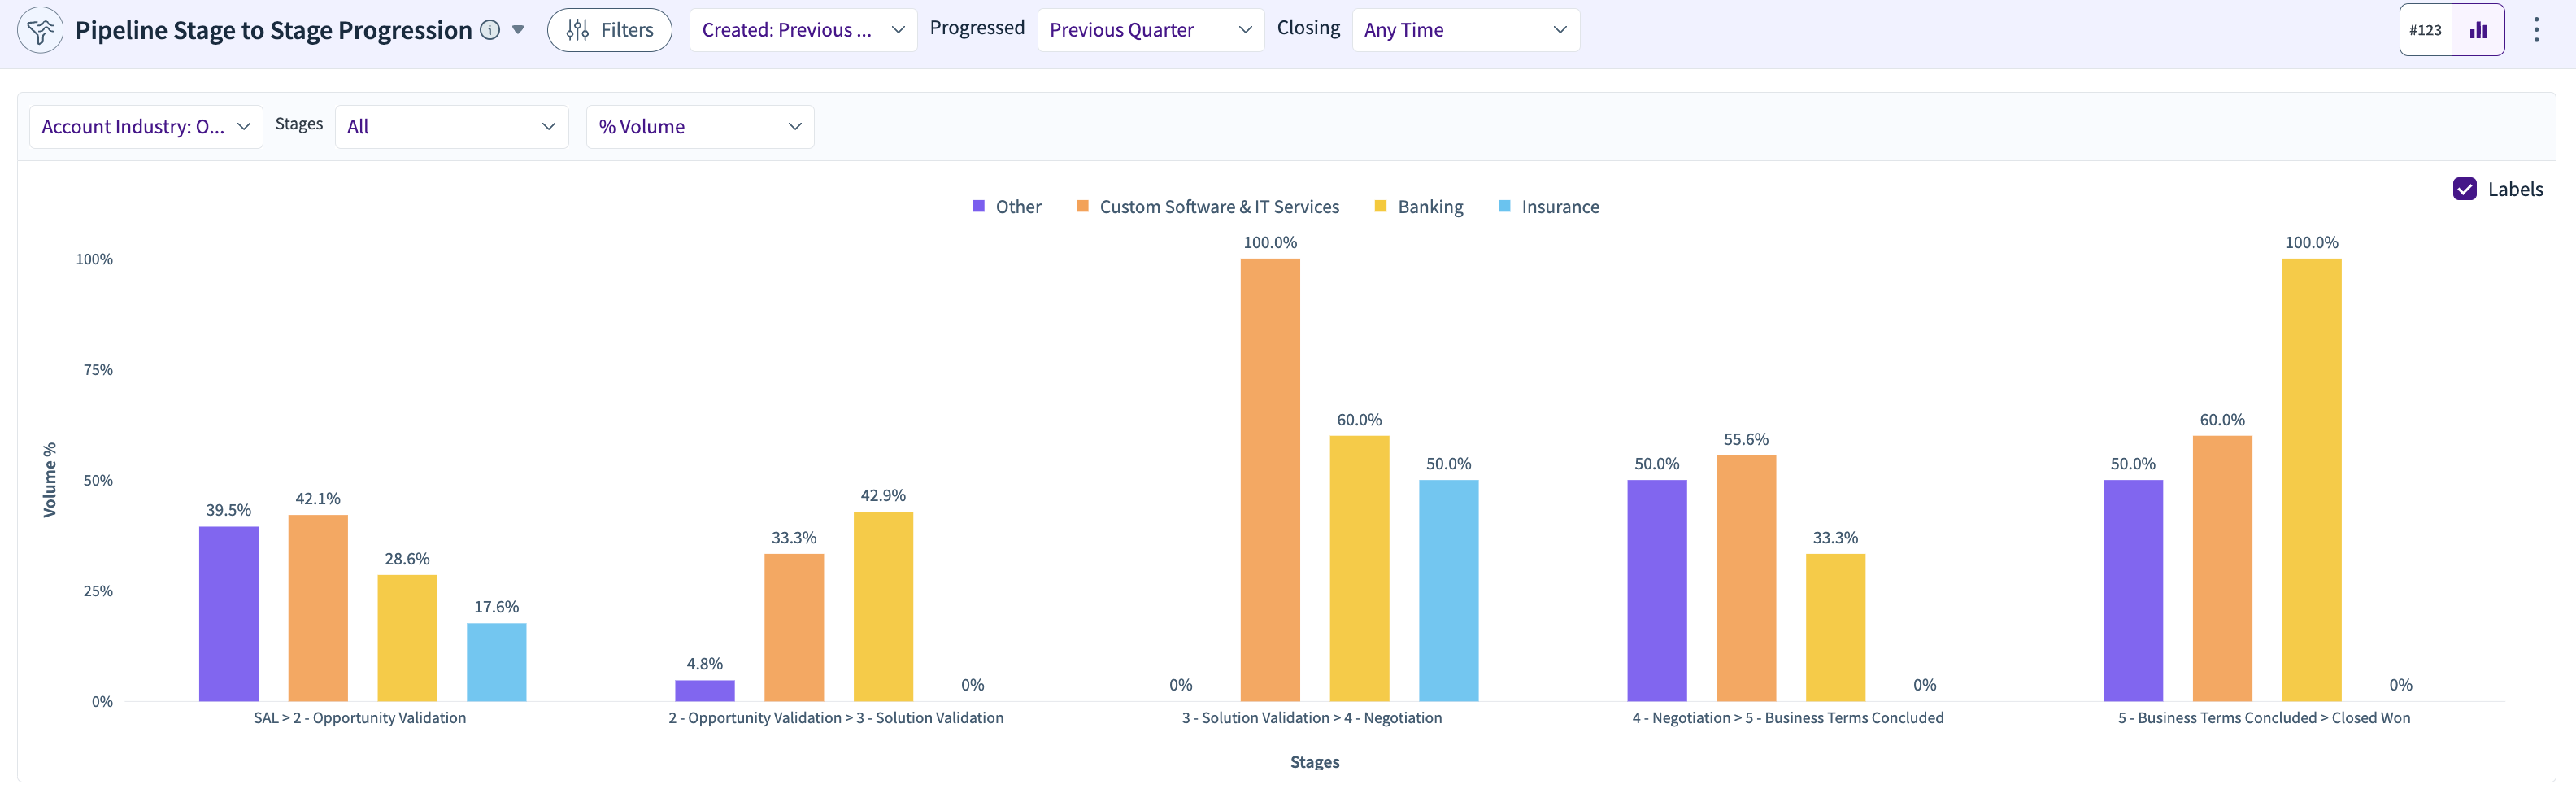
Analyzes how opportunities progress from one stage to the next, such as from “Pre-Qualified Opportunity” to “Prospecting” and beyond, showing progression rates.
Progression to Specific Stages
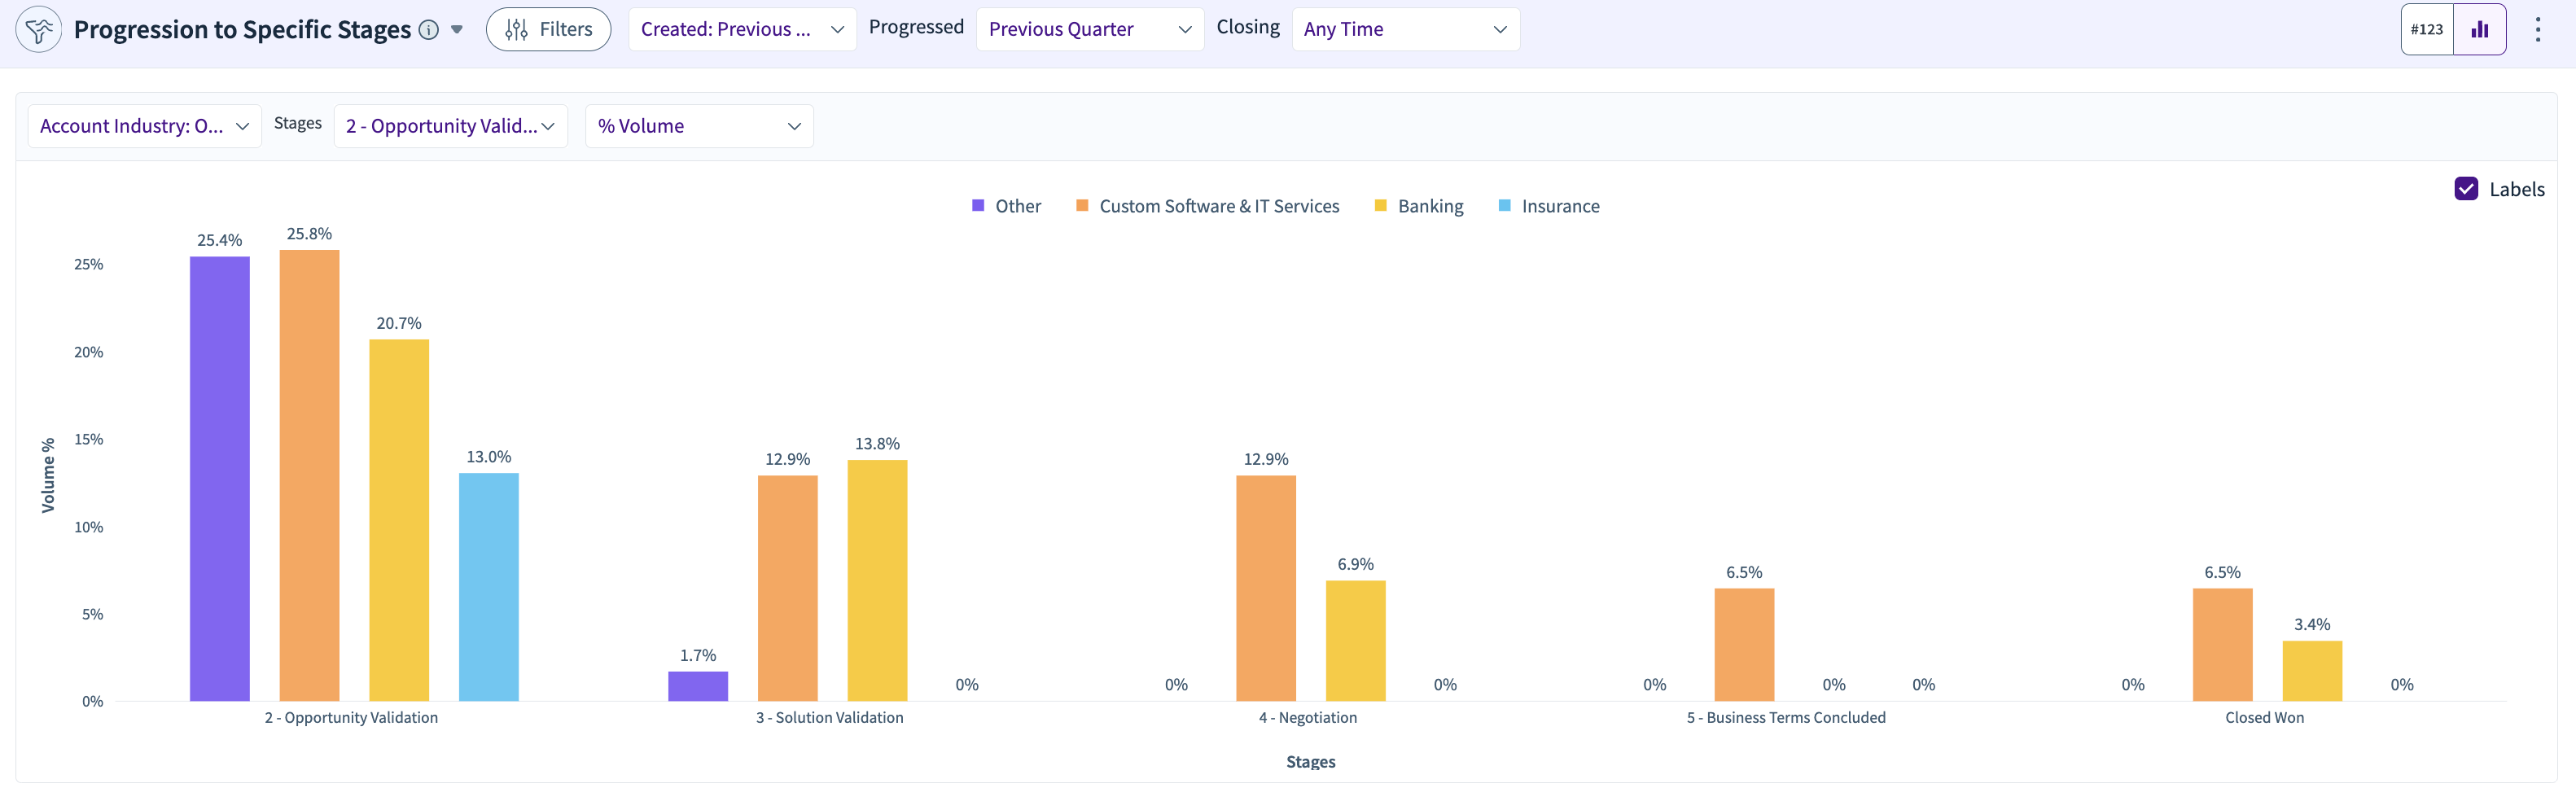
Tracks the count or percentage of opportunities that reach a specific stage, for example, 32.2% of opportunities progressed to "Initial Demo/Evaluation."
Pipeline Progression Trends
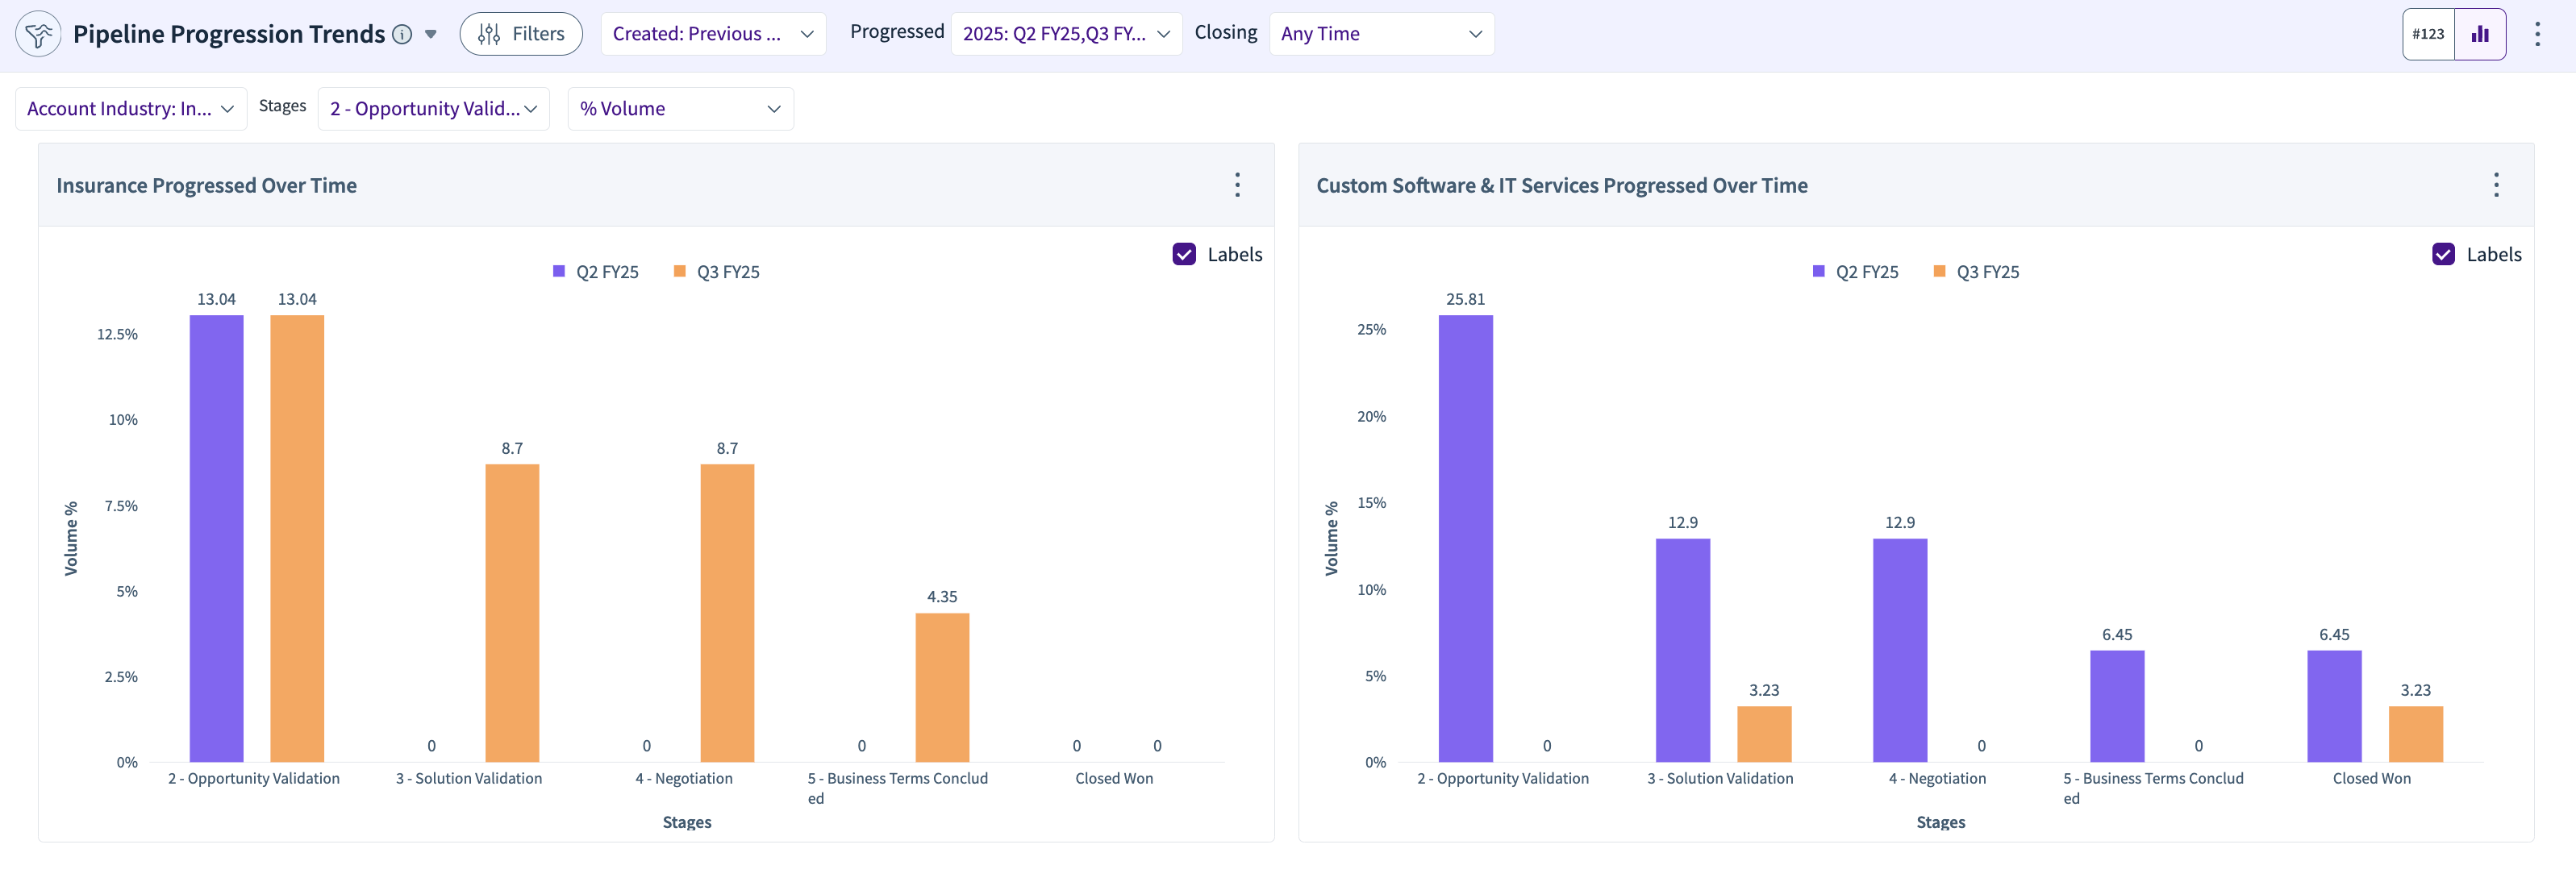
Displays quarterly trends of opportunities progressing to different stages, with options to split by region, channel, or industry (e.g., 31.4% of Q2 FY25 opportunities progressed to "Shortlisted").
Pipeline Development Trends
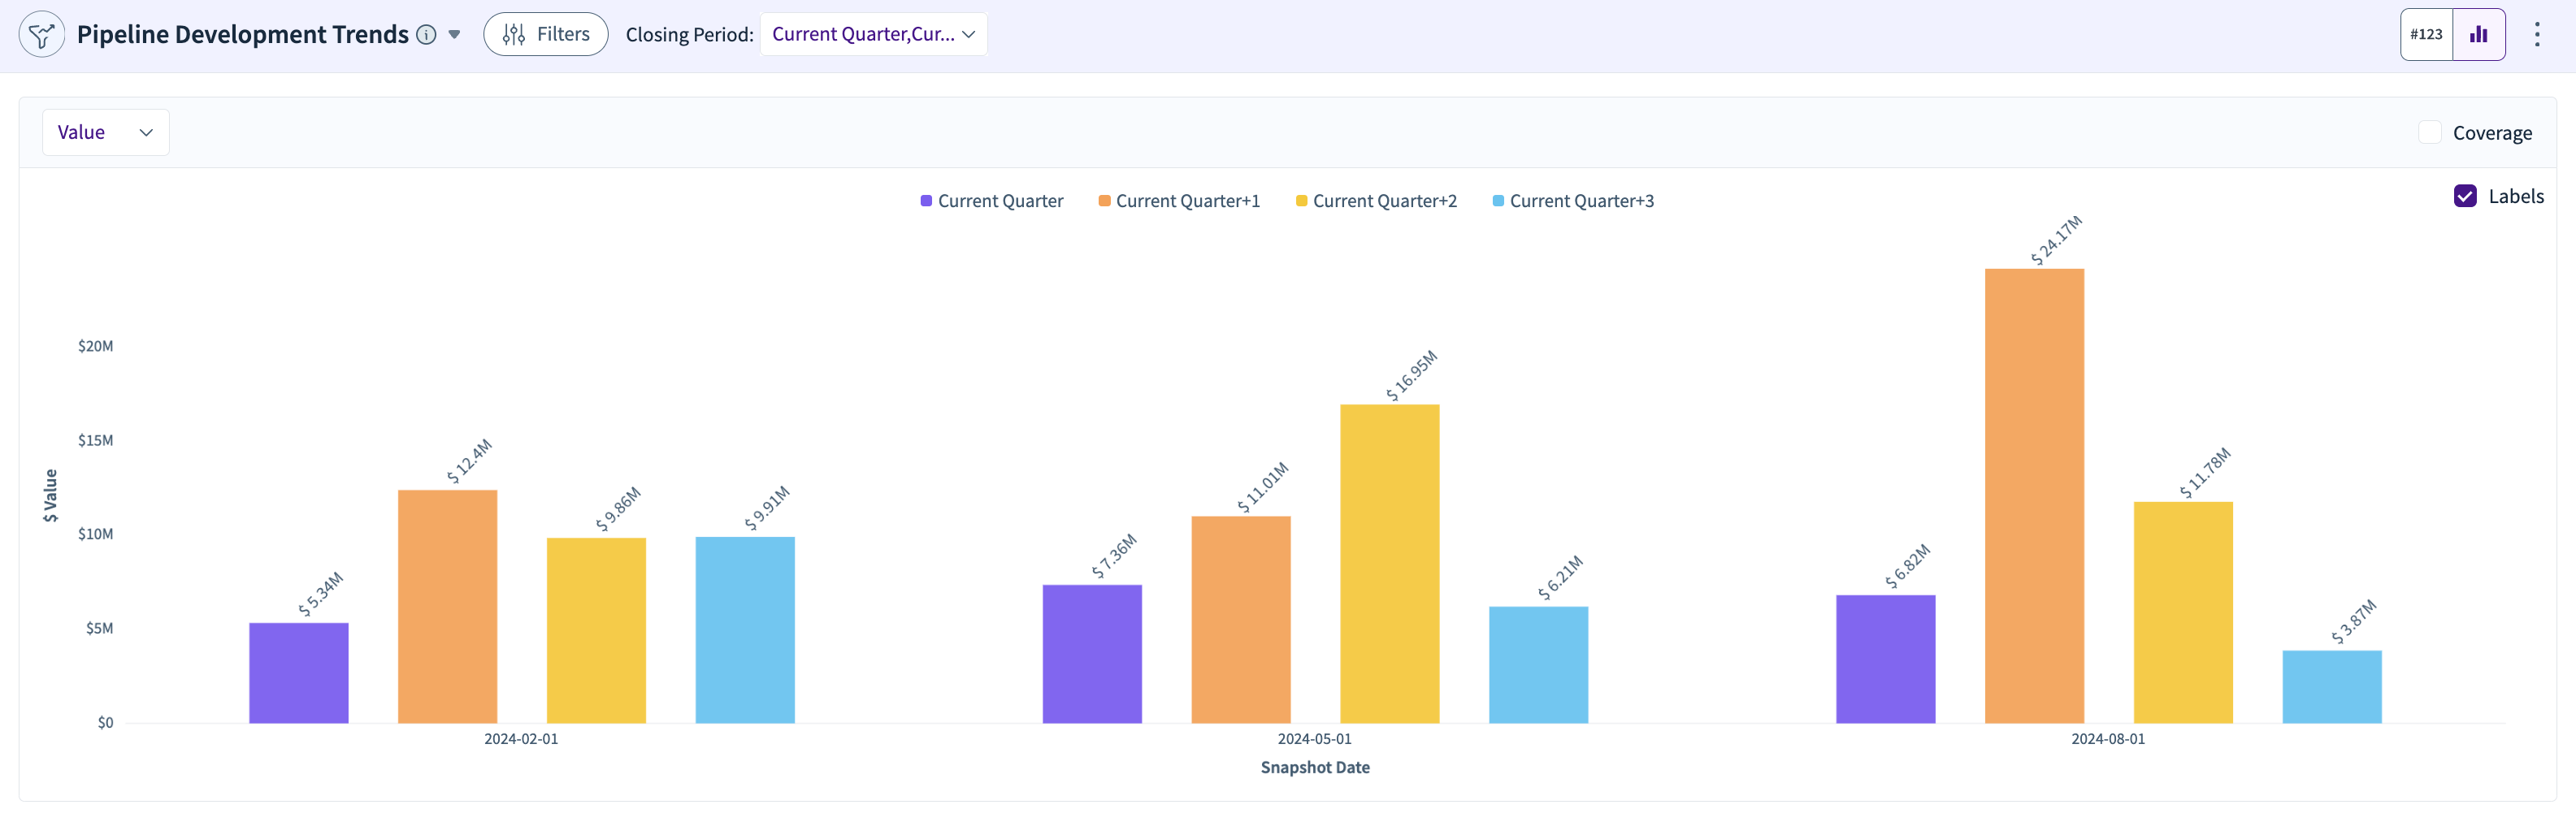
Shows a trend of open pipeline snapshots at the start of each quarter, enabling tracking of how the pipeline evolves.
Push Trend By Quarter
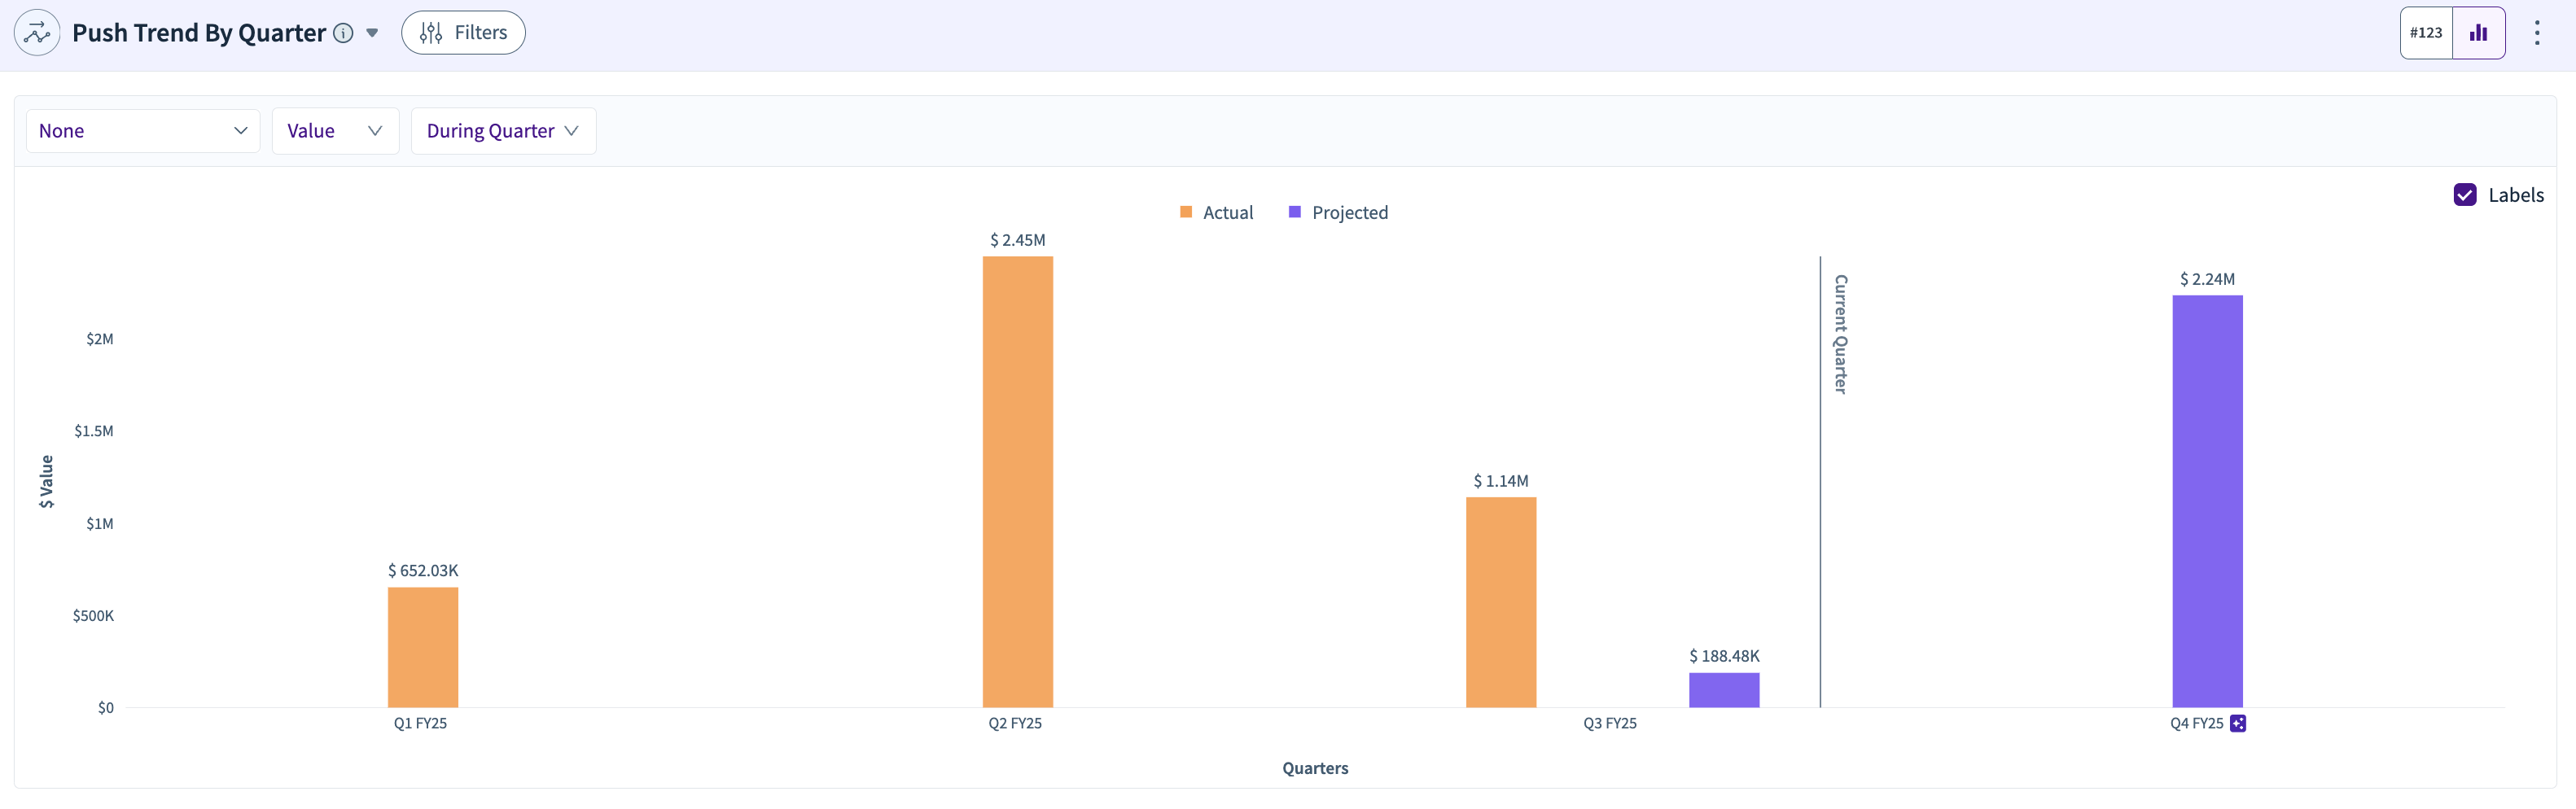
Tracks pipeline pushed out of its intended closing quarter into future quarters (e.g., $8.54M pushed out of Q2 FY25).
Pull Trend By Quarter
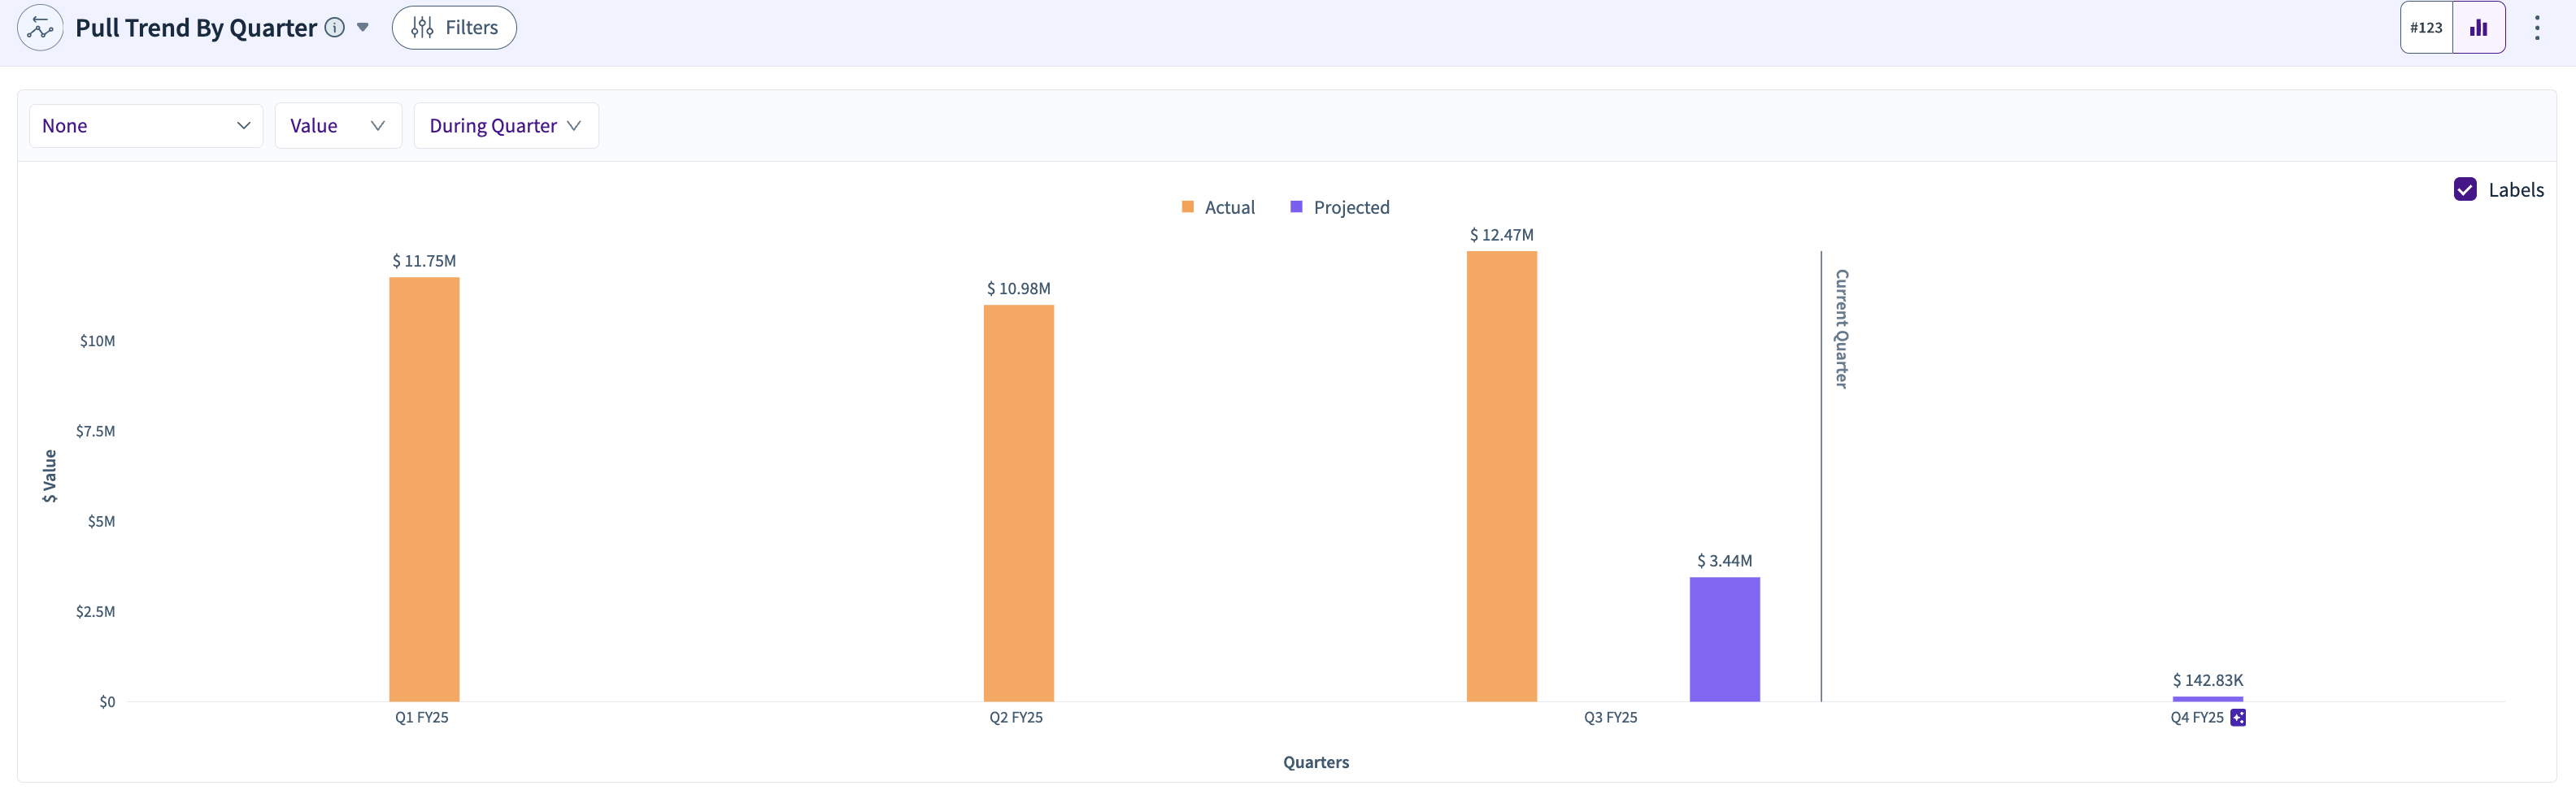
Tracks pipeline pulled into an earlier closing quarter, such as $23.27 M pulled into Q3 FY25 from other quarters.
Closed Lost Trend by Quarter of Close
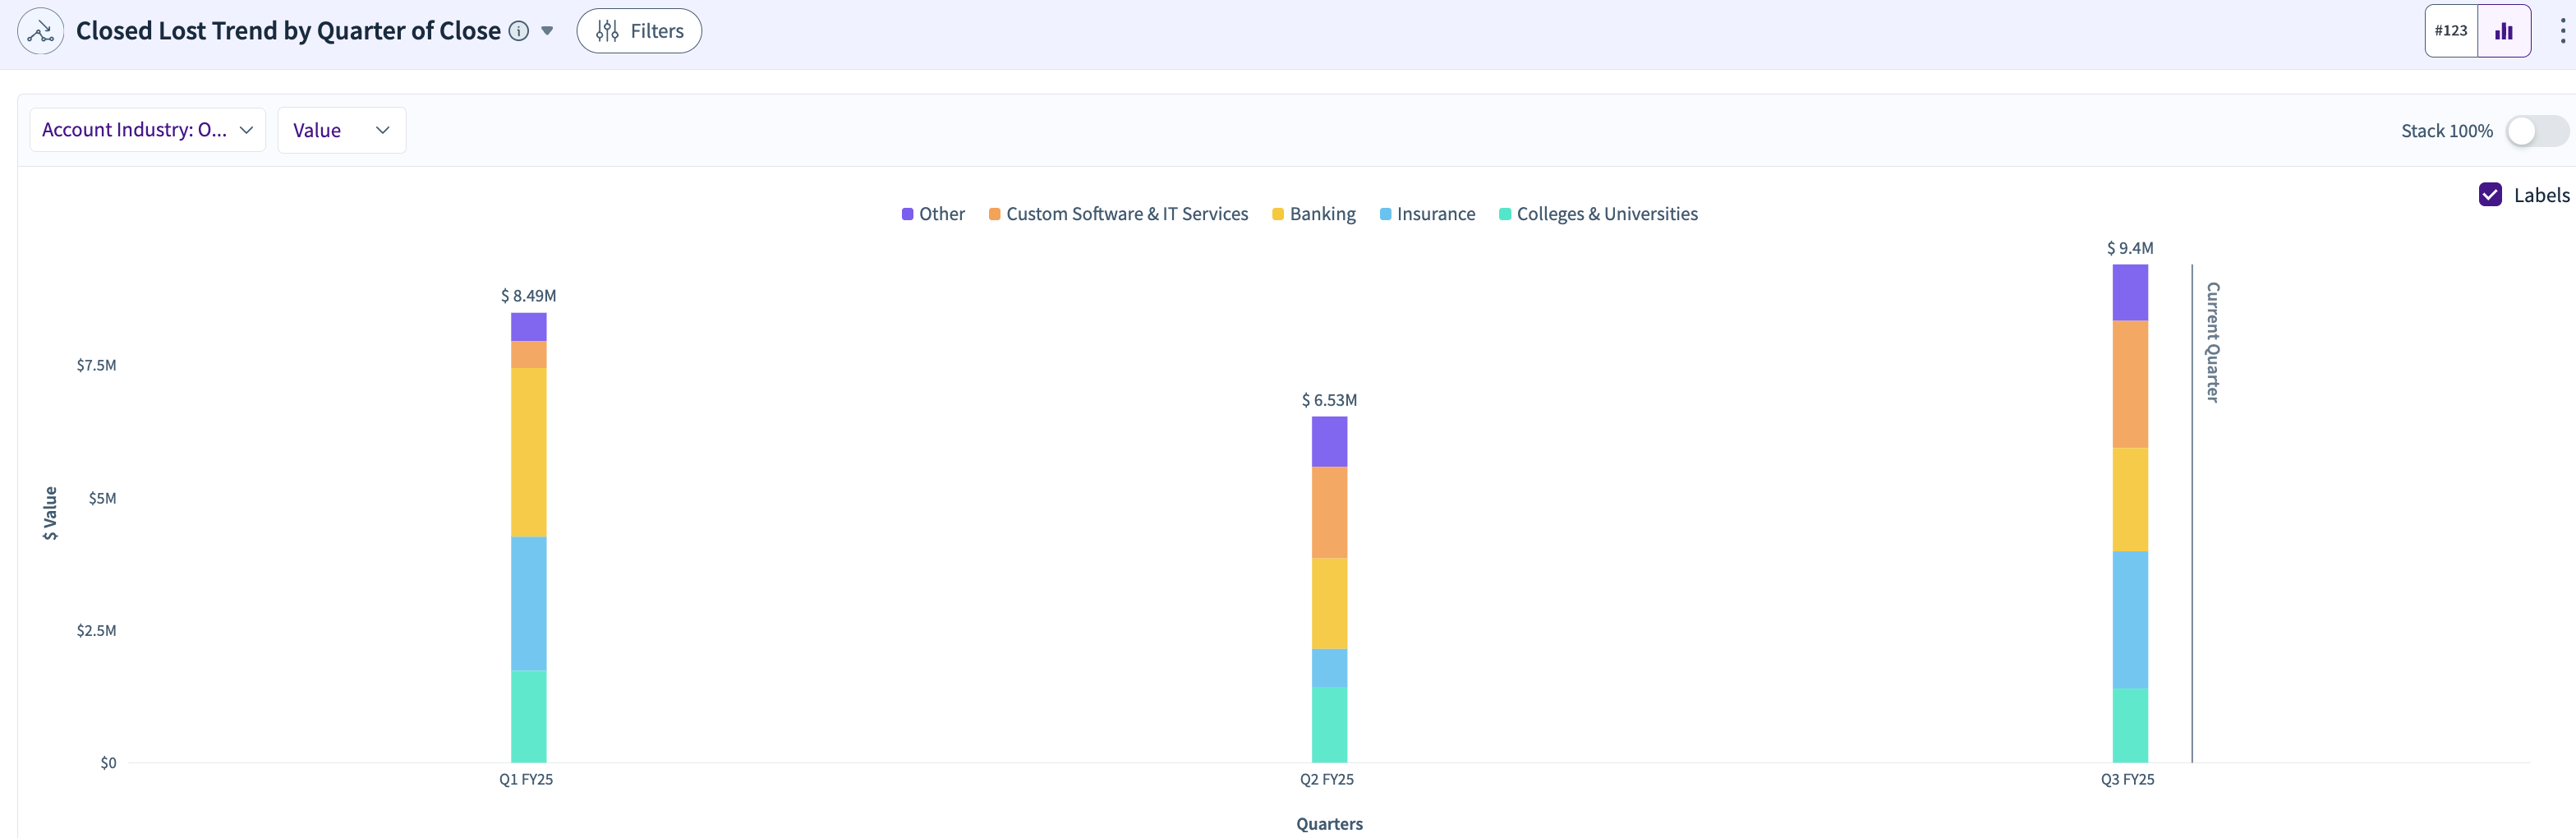
Displays the trend of closed-lost pipeline by quarter, tracking how much pipeline is lost over time (e.g., $34.48 M lost in Q1 FY25).
Pipeline Created and Closed by Quarter
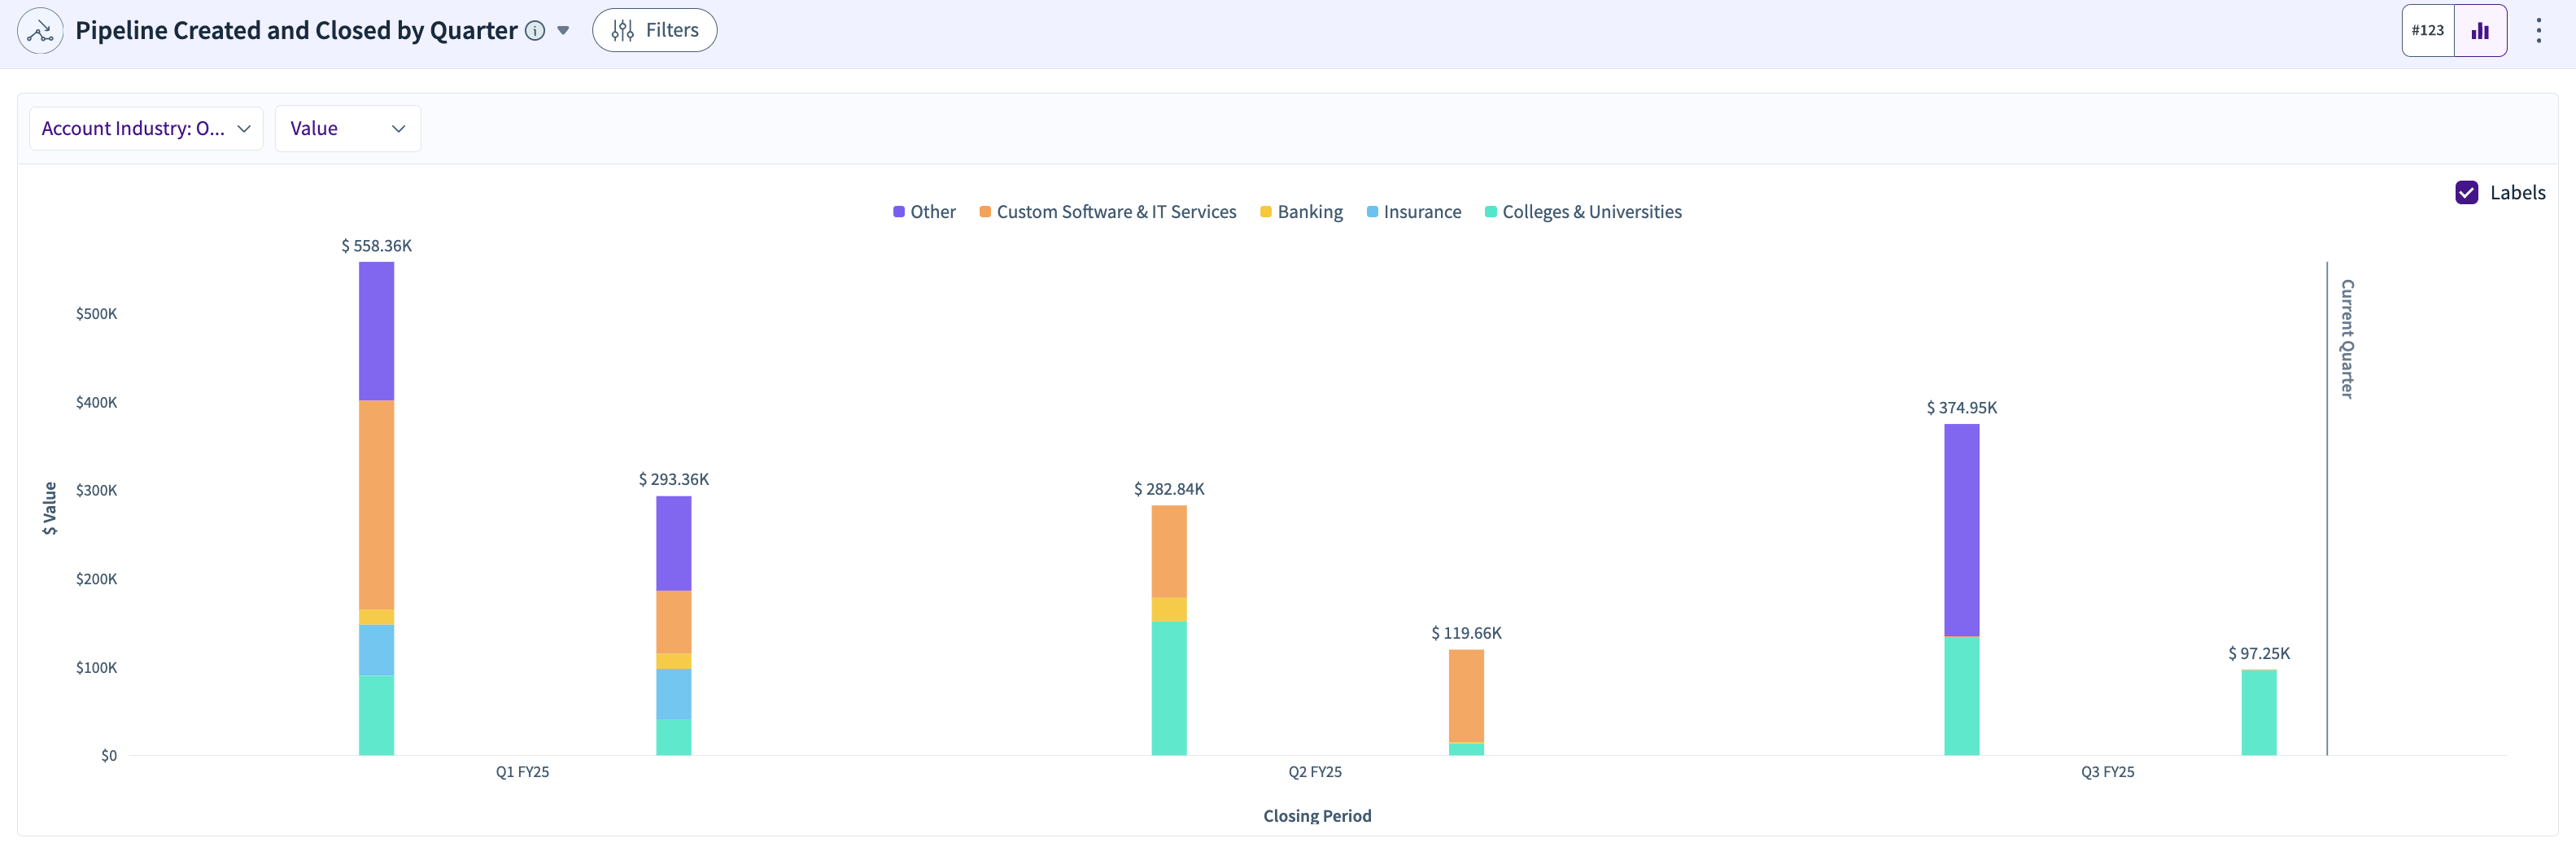
Shows the pipeline that was both created and closed within the same quarter, for example, a pipeline of $969K was created and $550.1K closed in Q3 FY25.
Walk-in Pipeline Win Rate by Quarter
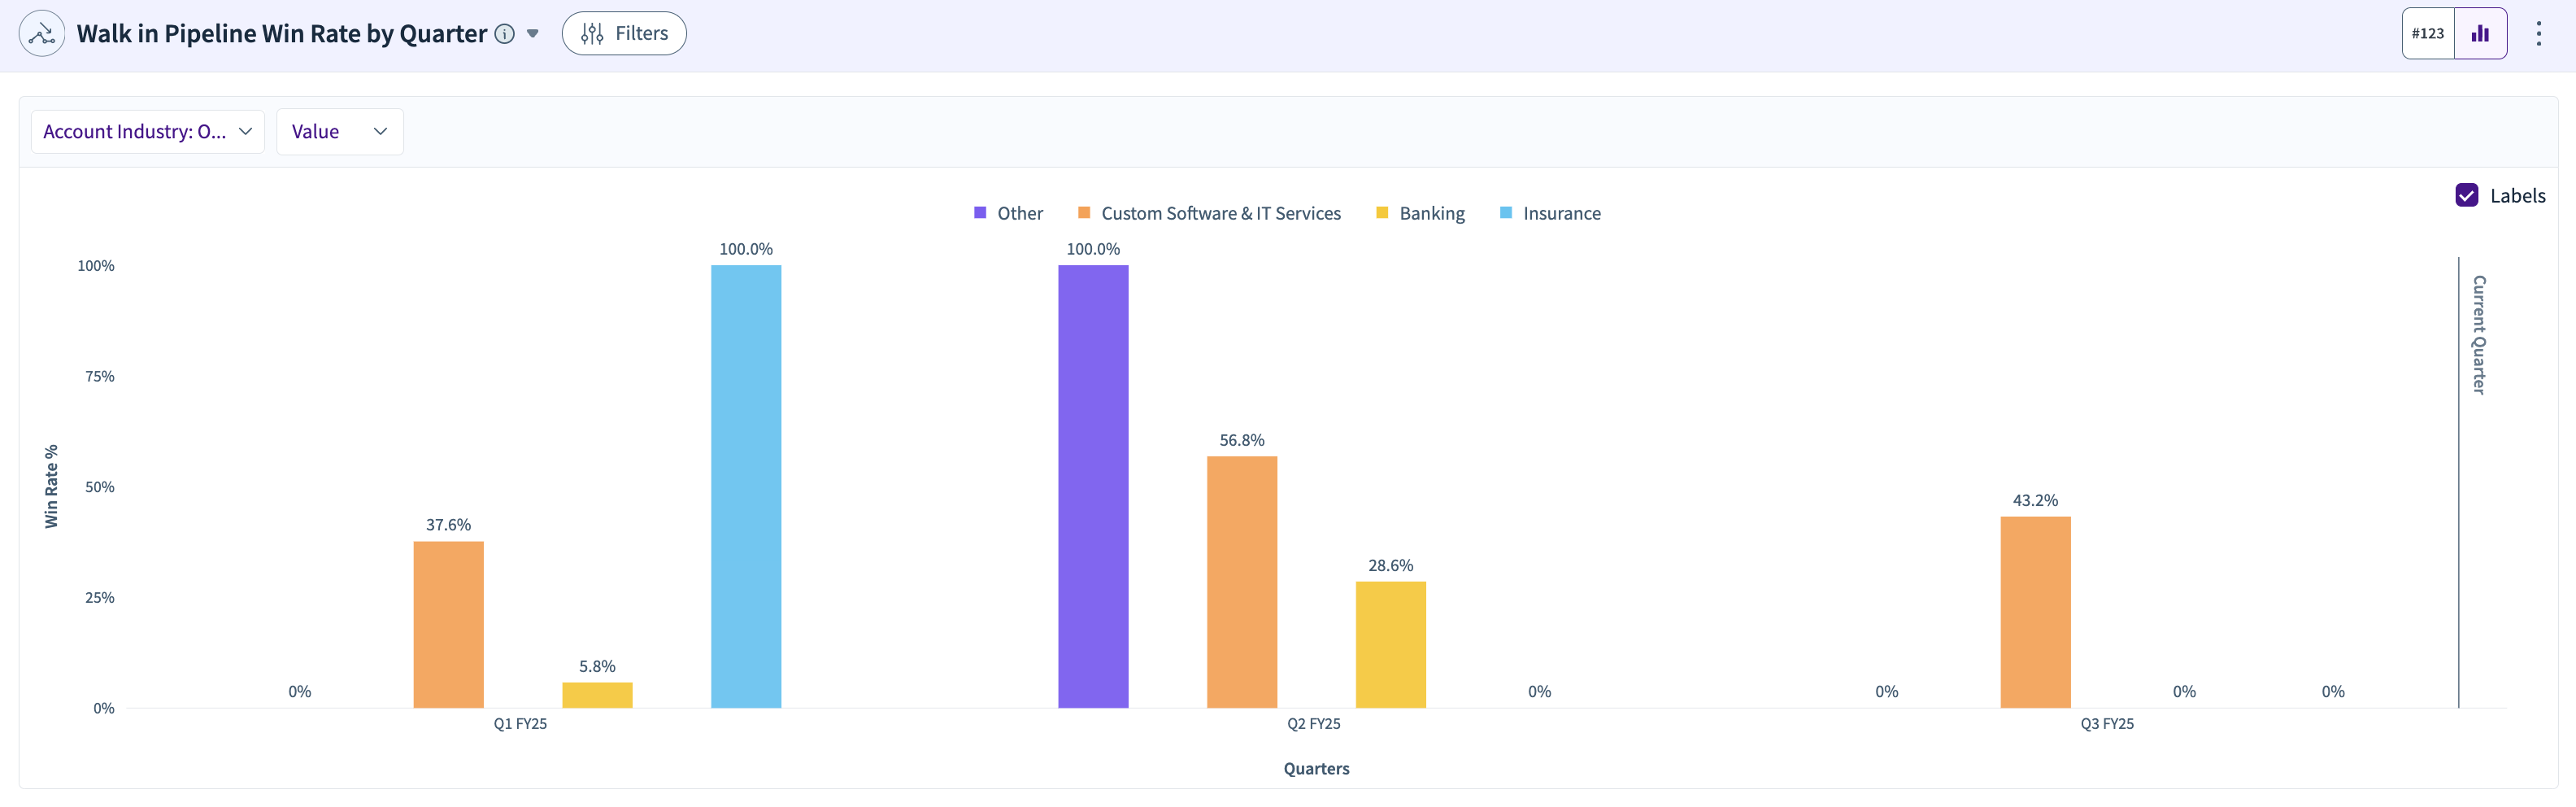
Tracks the win rate for the walk-in pipeline that converted to bookings within the same quarter, such as an 18.5% win rate for Q3 FY25.
Opportunity Size by Quarter
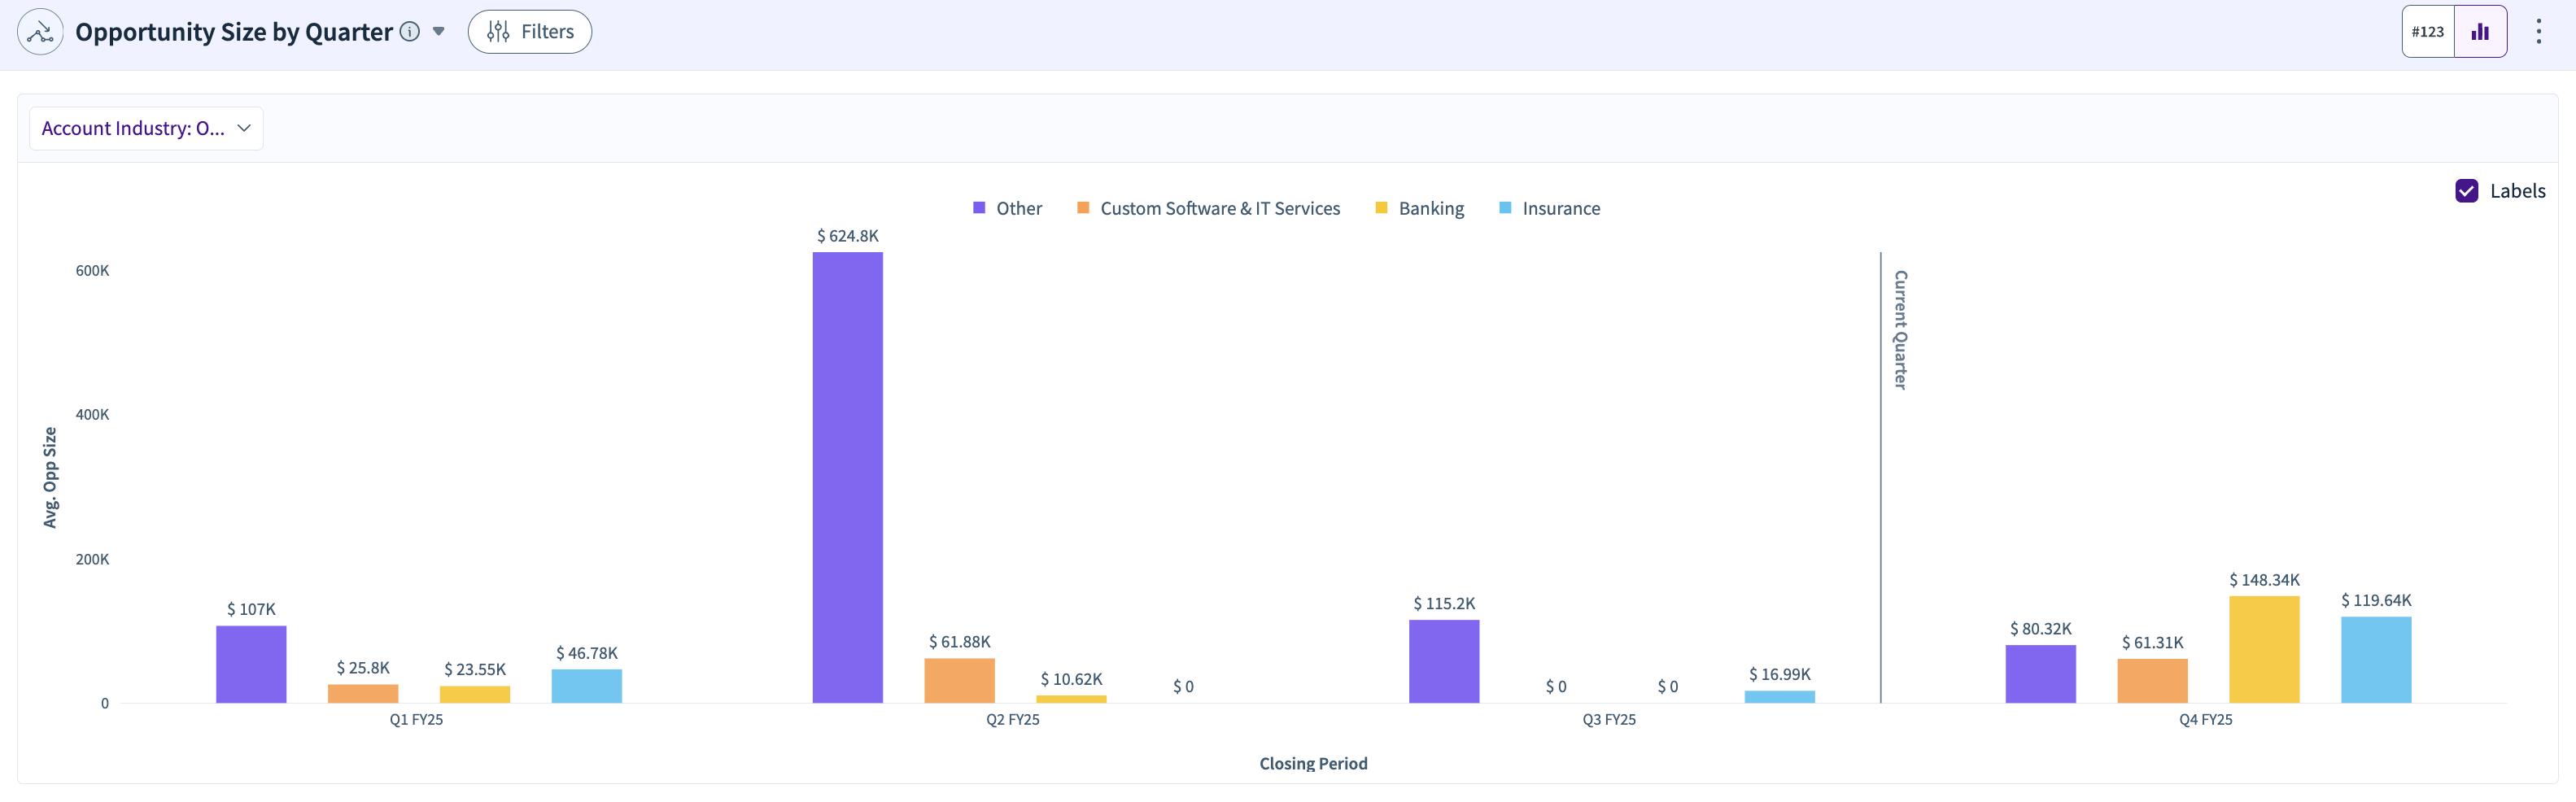
Displays the average deal size for opportunities closing in each quarter, with average sizes like $314.63 K for Q2 FY25.
Pipeline on Day "x" of Quarter
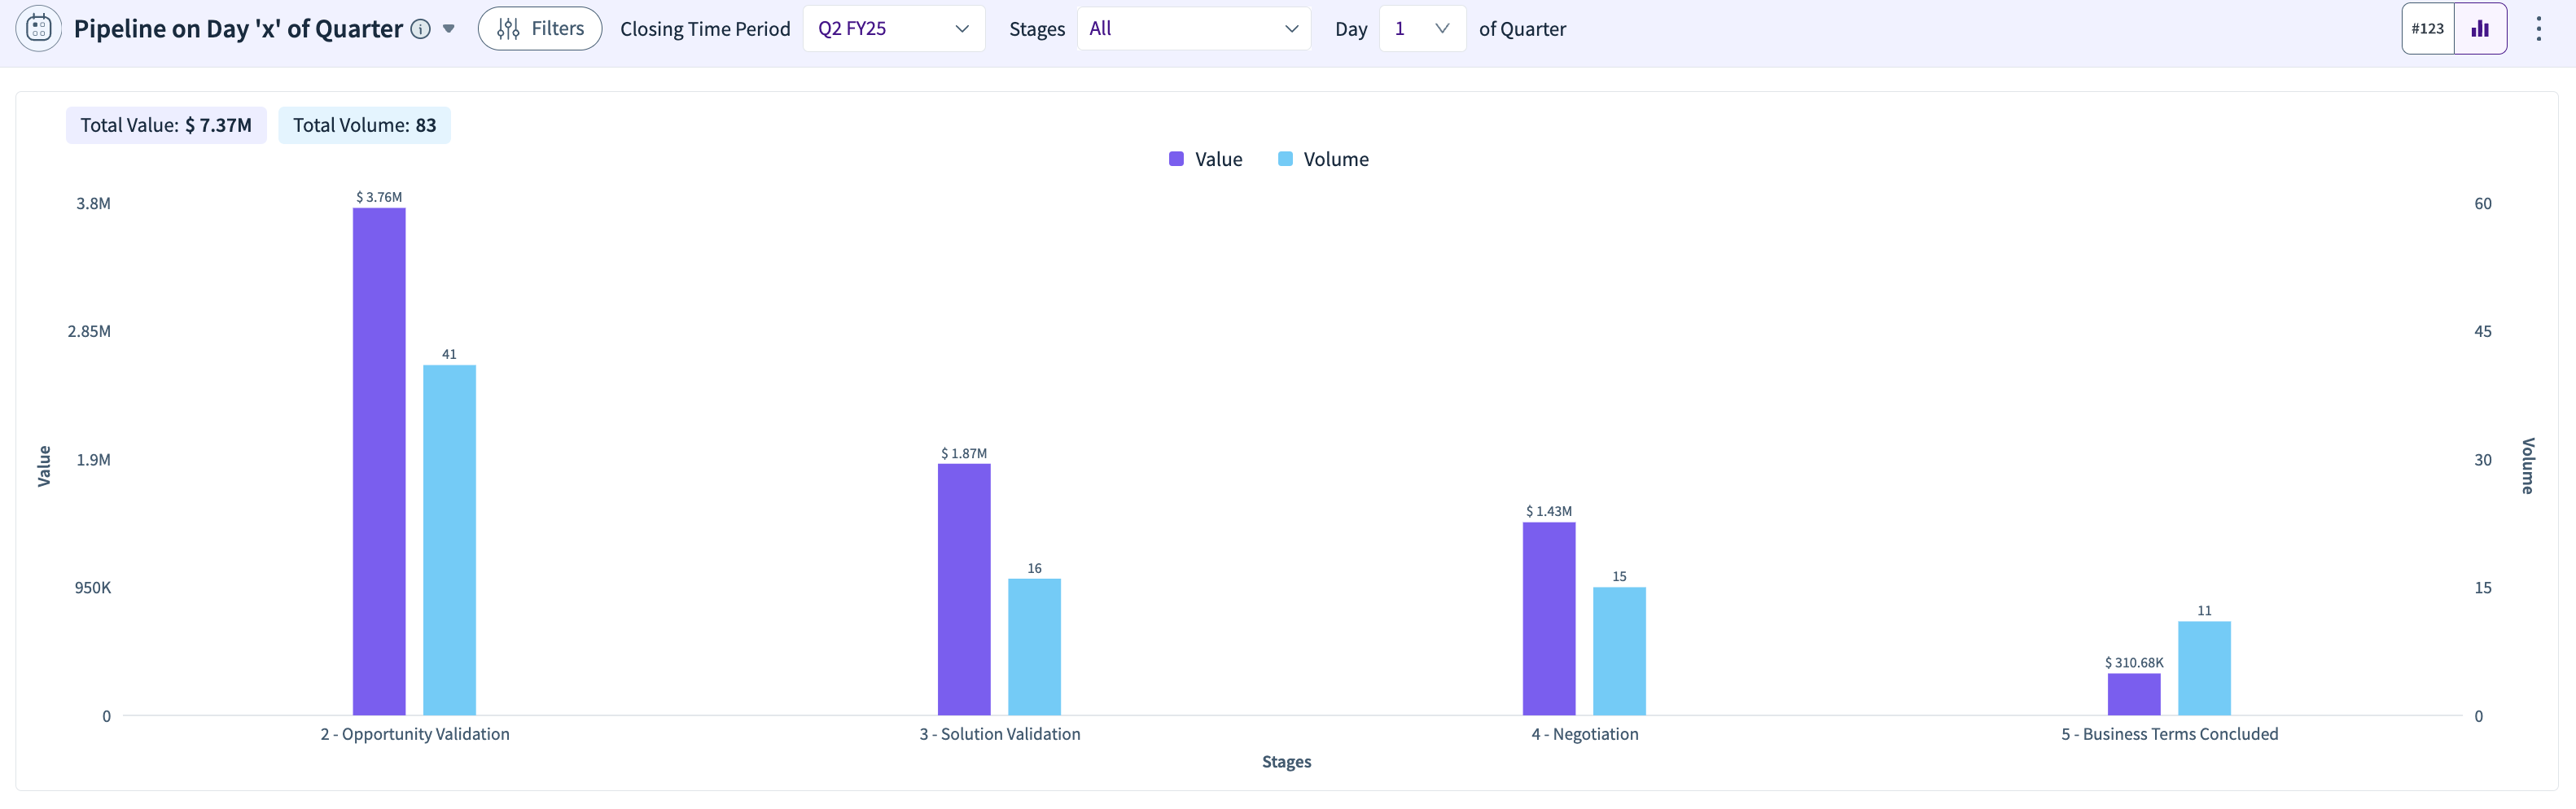
Shows pipeline status on a specific day of the quarter, such as day 1 or day 30, allowing a comparison of pipeline growth throughout the quarter.
Daily Booking Trends by Quarter
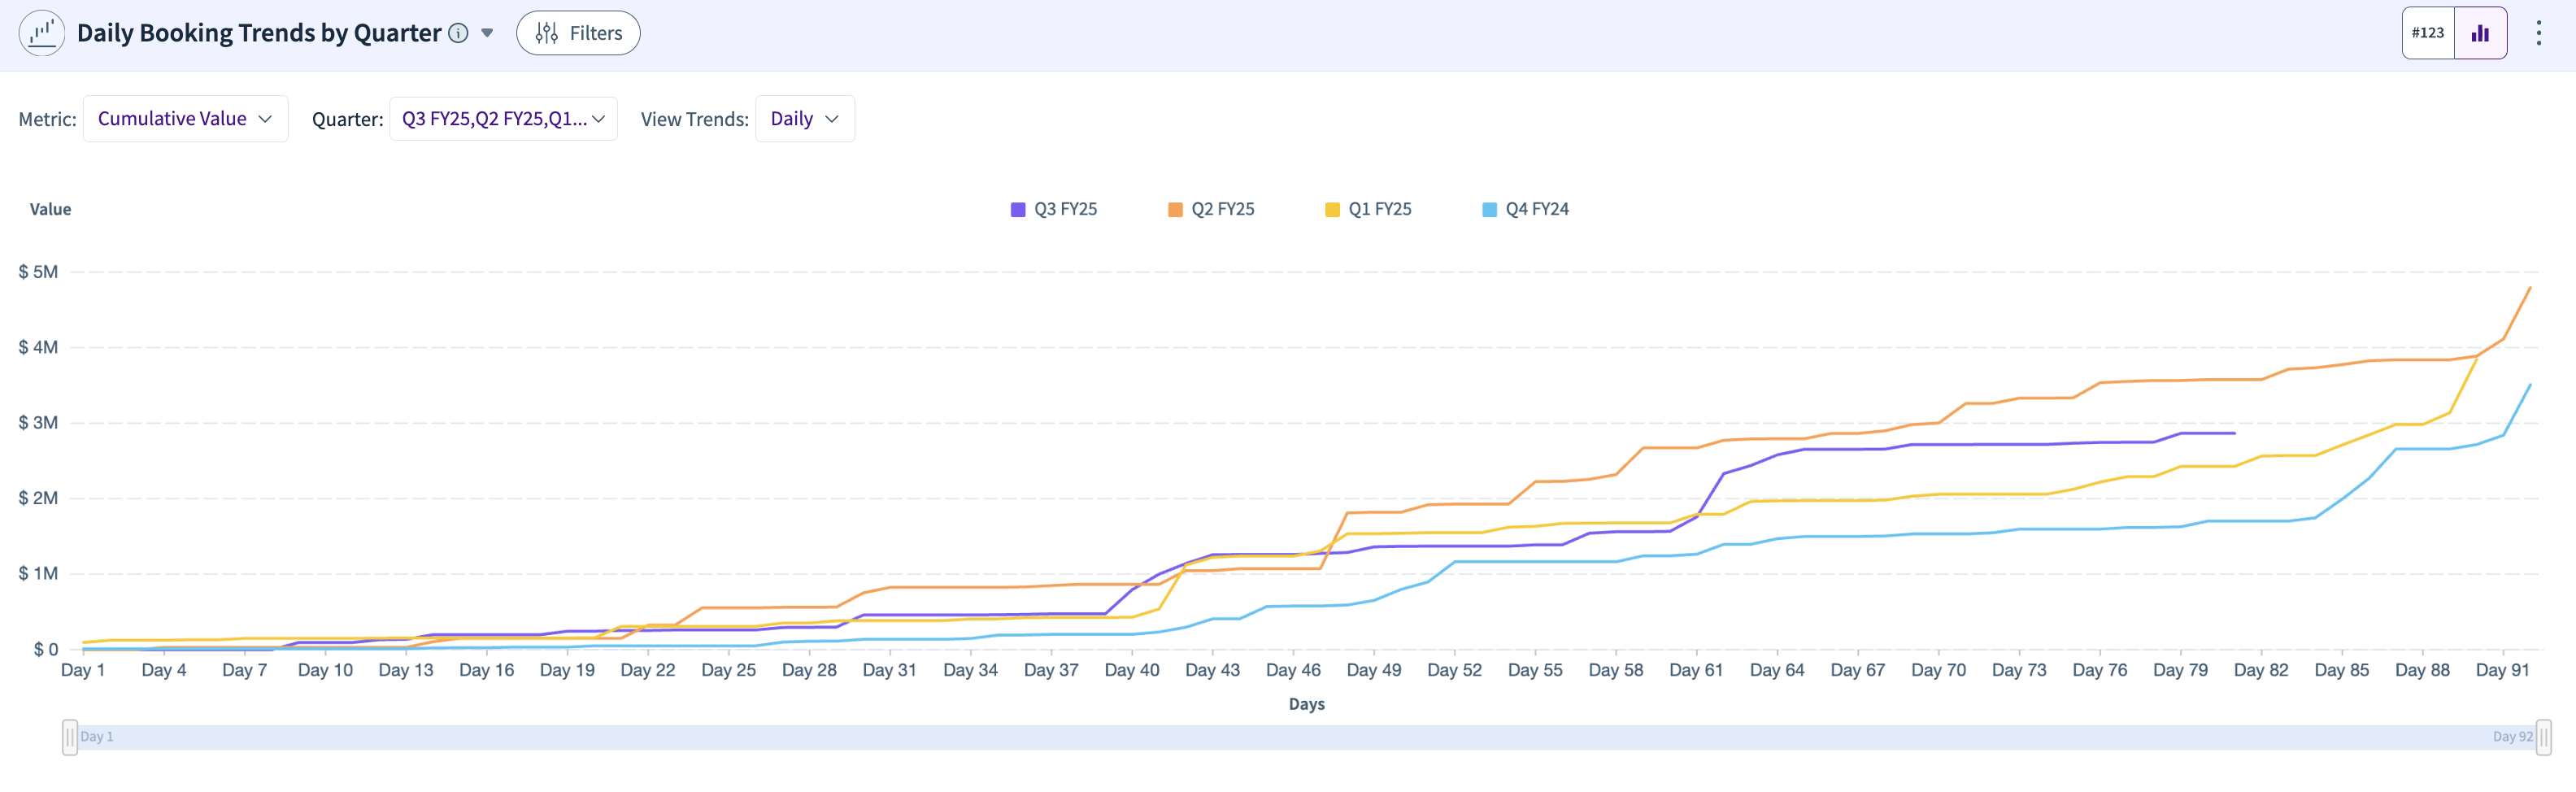
Compares daily booking trends across multiple quarters, tracking day-to-day fluctuations and cumulative booking progress.
Daily Pipeline Generation Trends by Quarter
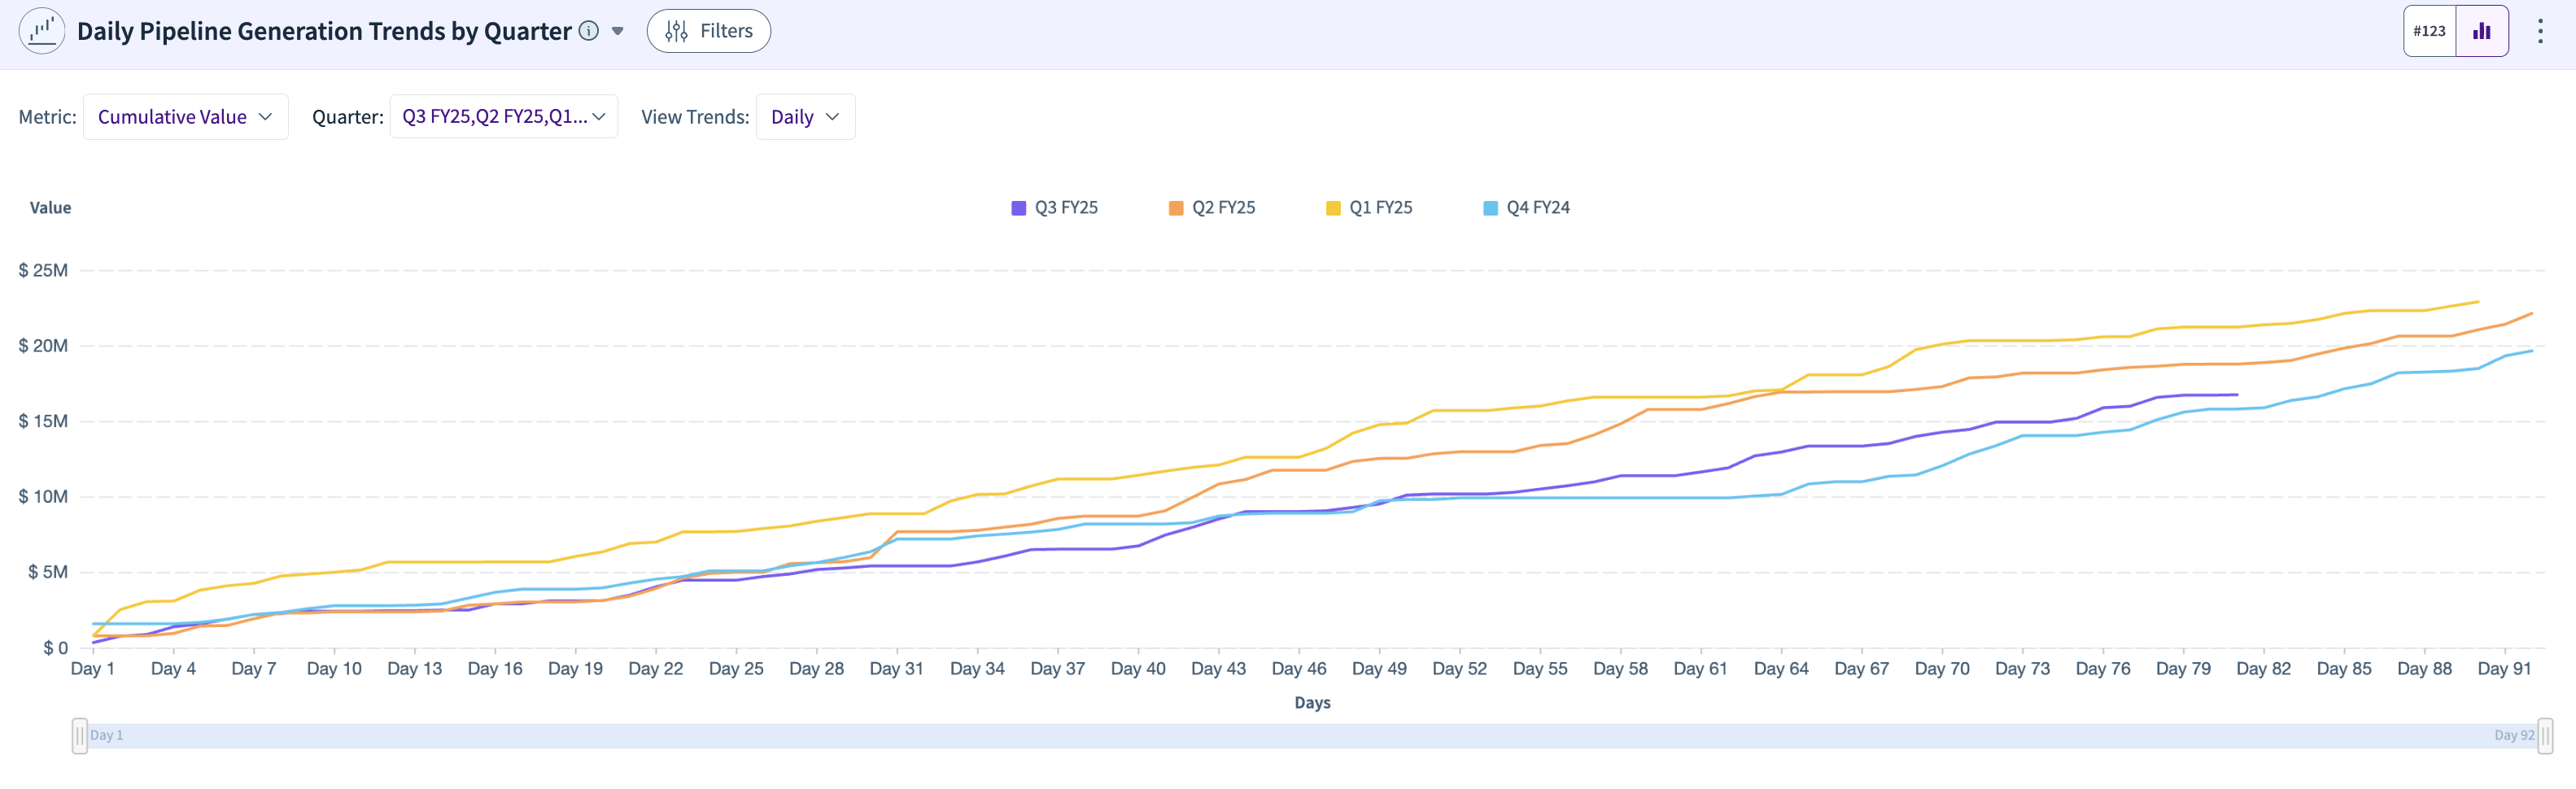
Compares daily pipeline generation trends across multiple quarters, showing how new opportunities are added daily over time.
Cumulative Cohort Conversion Trends
.png)
Gives you a view of the pipeline and closed won conversion values. You can also look at the conversion % across different quarters as a cumulative view. For eg, in Q2 2024, if the created is 100M, and the converted in Q2 2024 is 15M, show 15% (15/100) in Q+0. If converted in Q3 2024 is 5M, show 20% ((15+5)/100) in Q+1, and so on.
Pipeline Health
Pipeline Health Overview
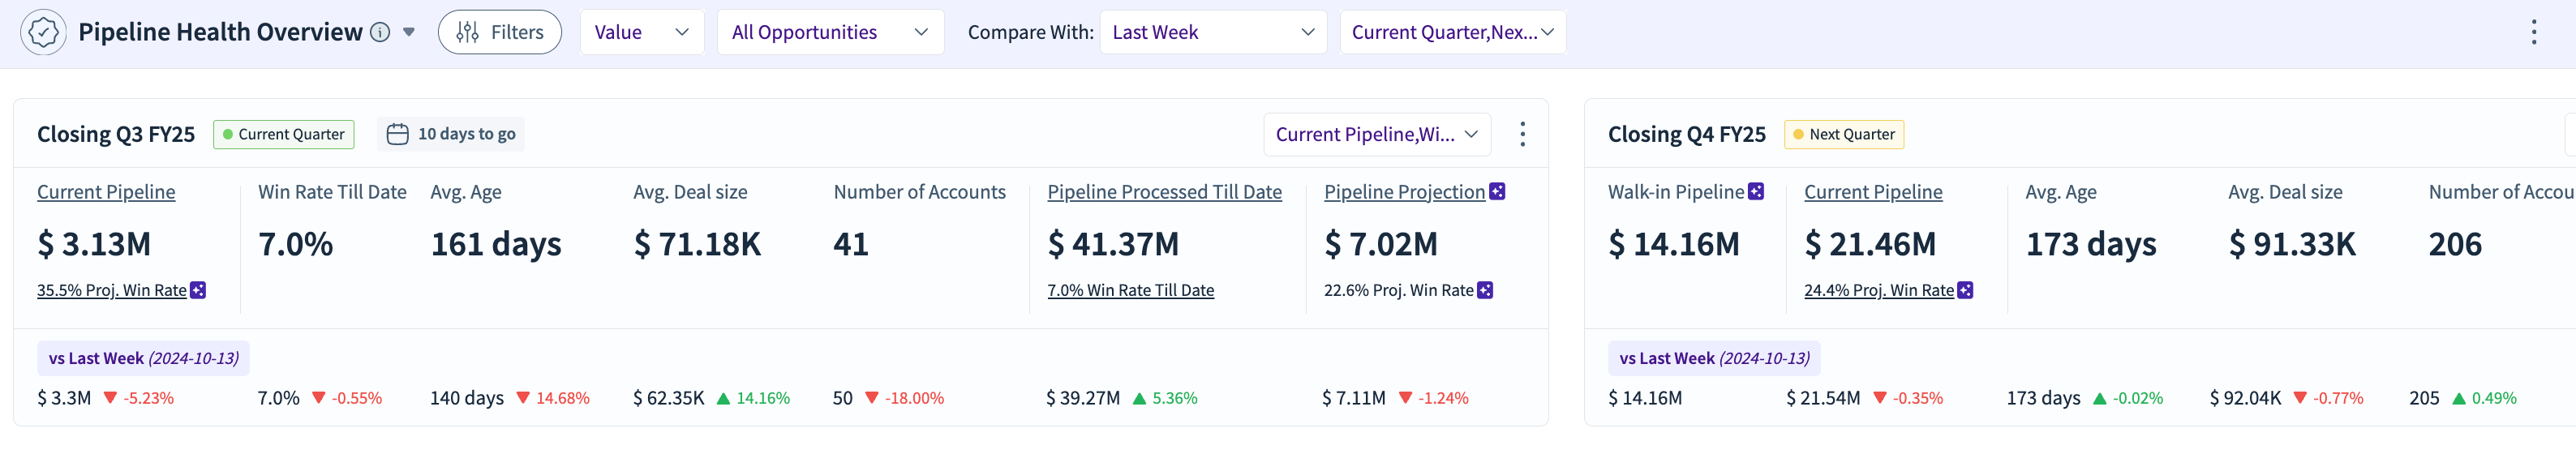
Quickly spot stalled deals or stages with low conversion rates to take immediate action and keep your pipeline flowing.
Top Factors Influencing Win Rate
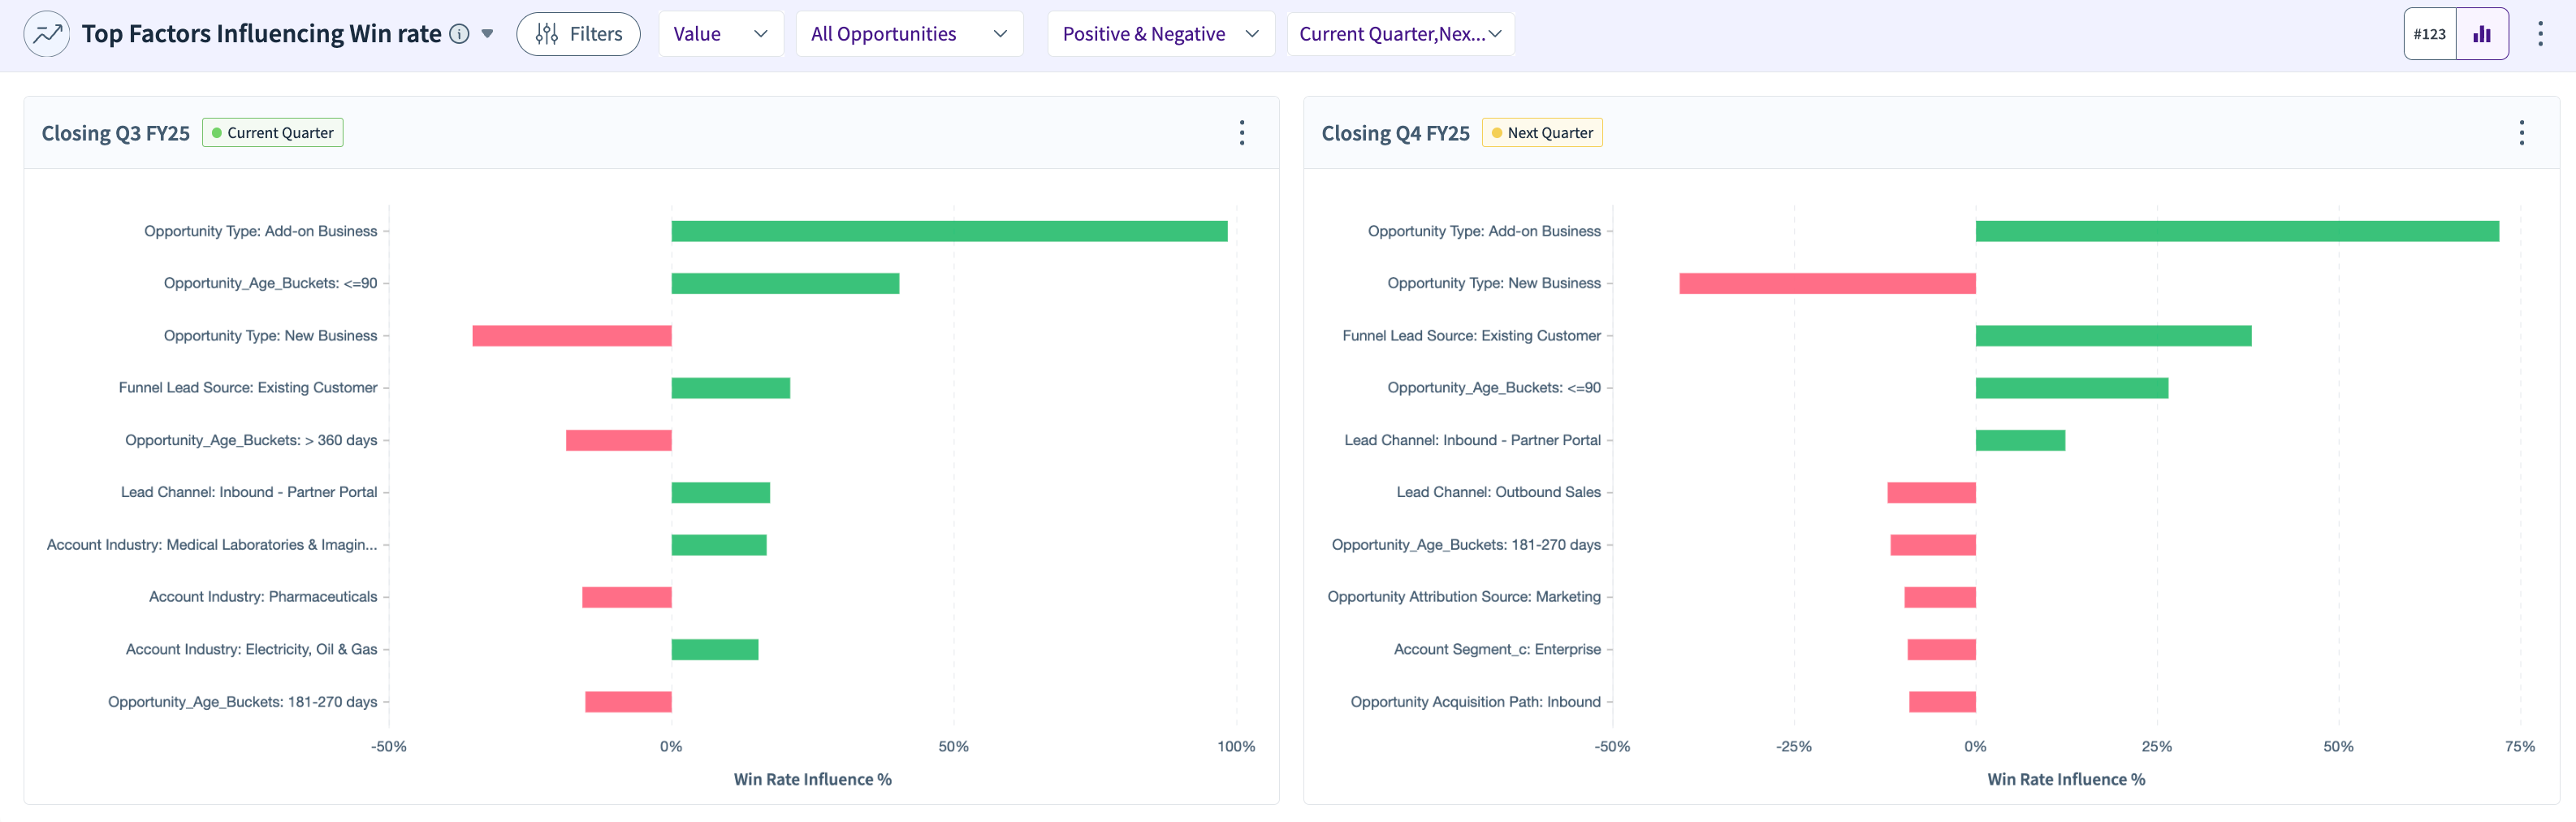
Focus on improving key drivers like deal size or industry to boost your win rate and hit your targets.
Pipeline Stage Breakdown
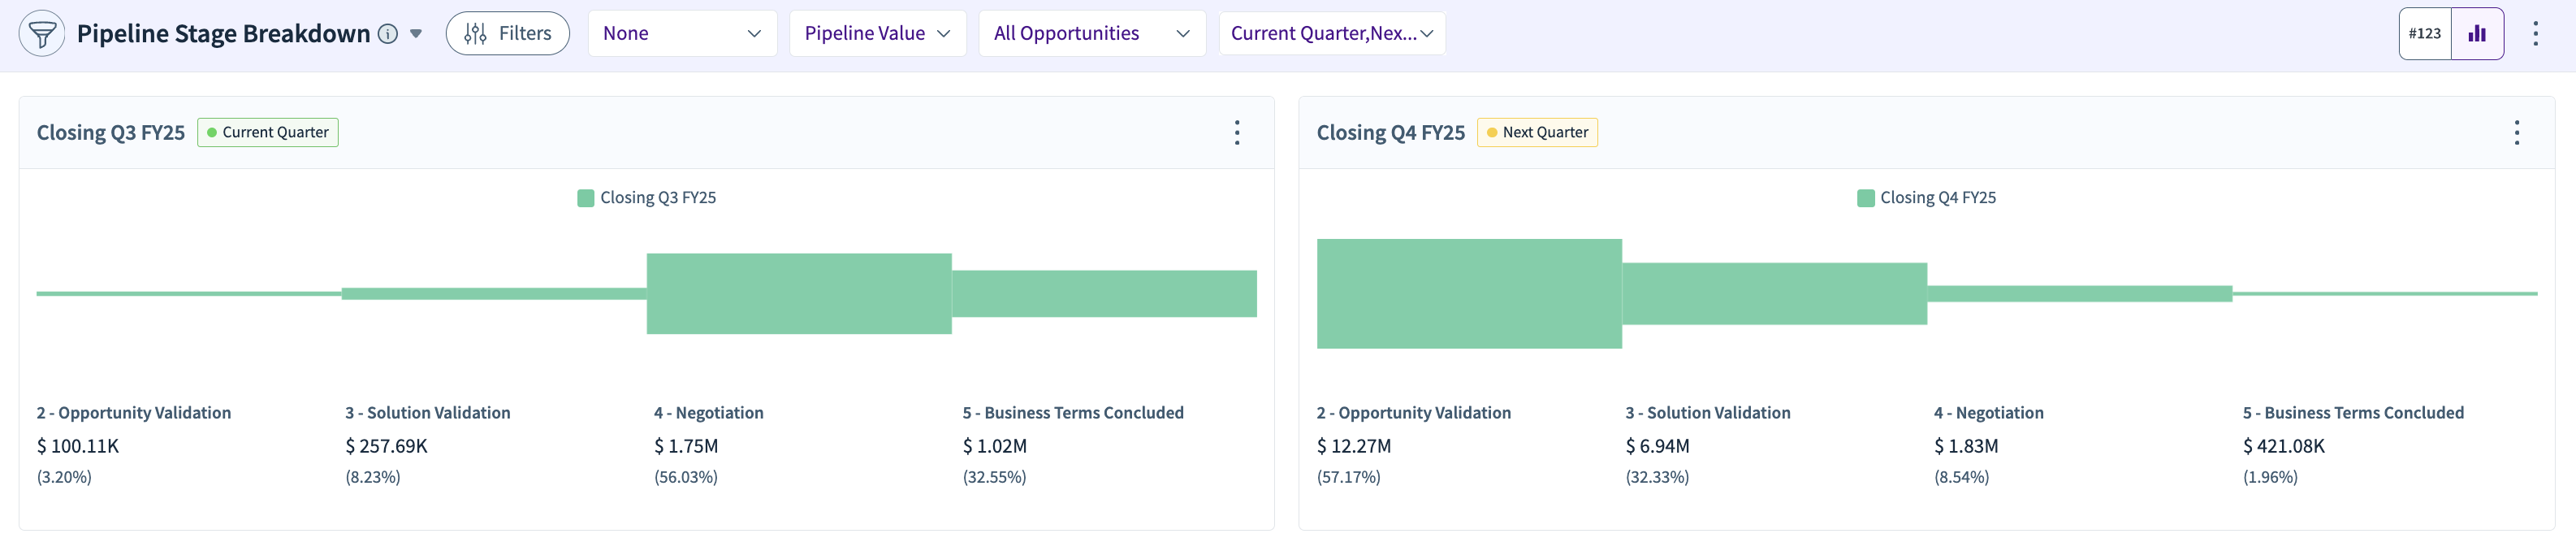
Identify bottlenecks in your funnel and adjust your approach to move leads faster through each stage.
Pipeline Composition Breakdown
.png)
Analyze deal sizes and stages to prioritize high-value opportunities and refine your resource allocation.
BI Reporting & Dashboarding
BI - Bar Chart
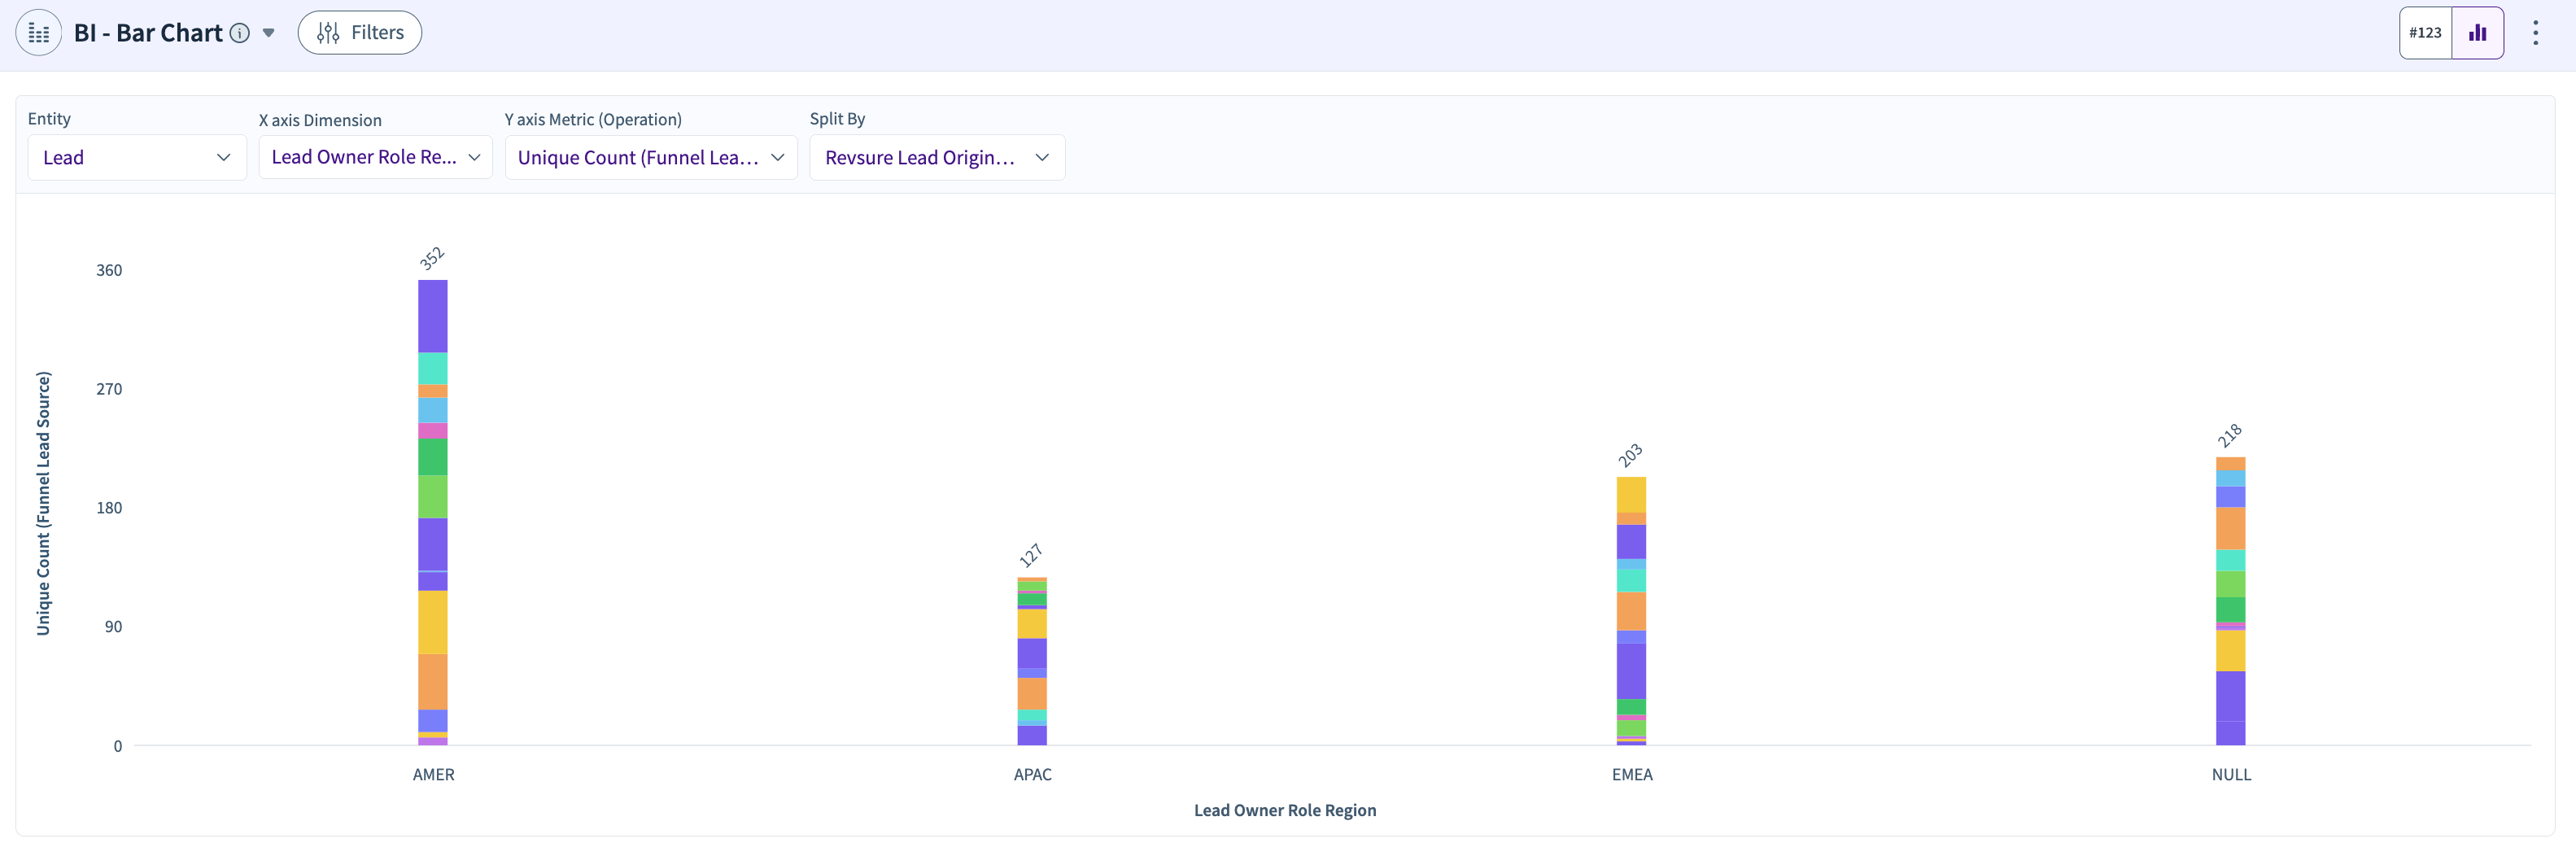
Use bar charts to compare metrics like MQLs generated by quarter or meetings booked per campaign to easily spot differences and trends.
BI - Trend Chart
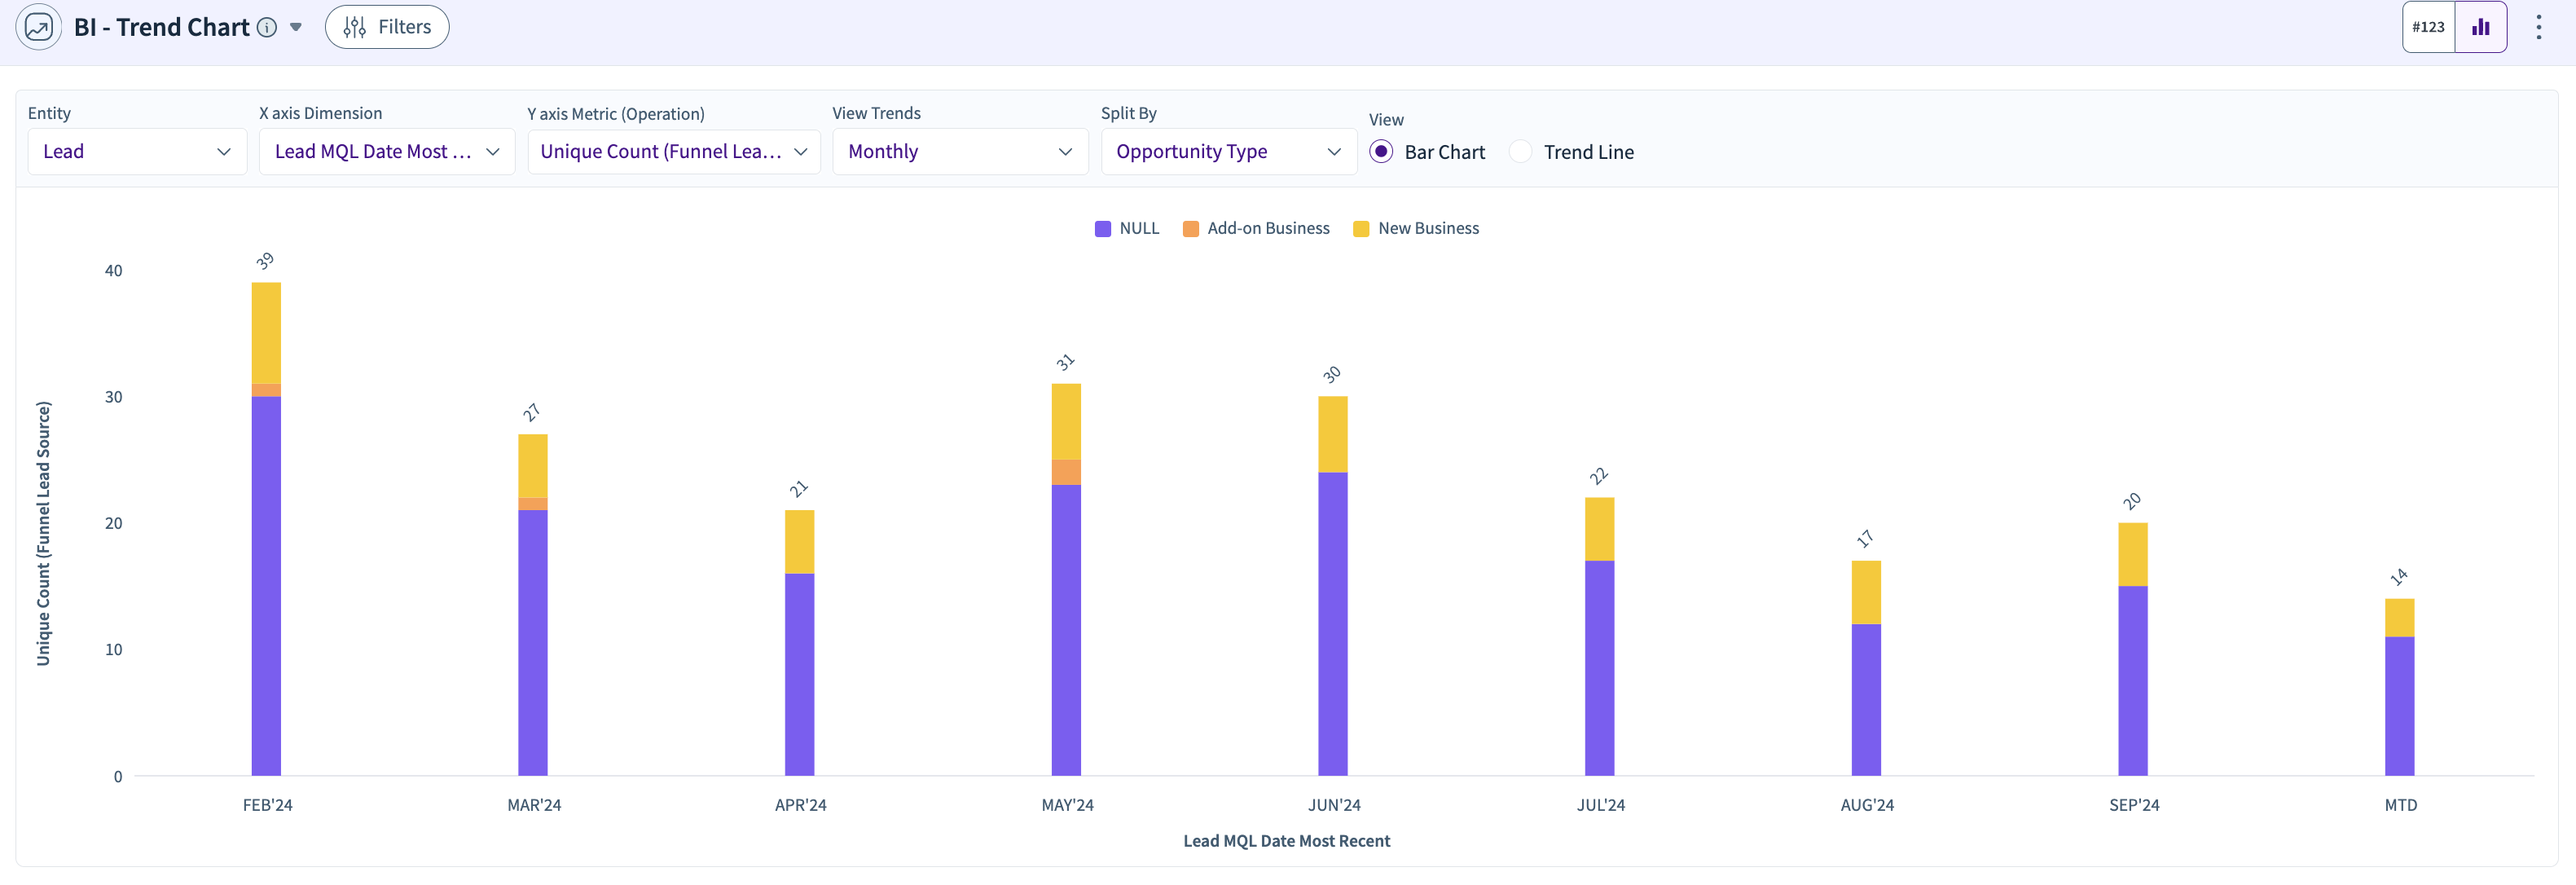
Track how your data changes over time with trend charts showing opportunities created monthly or pipeline growth over time.
BI - Cross Table
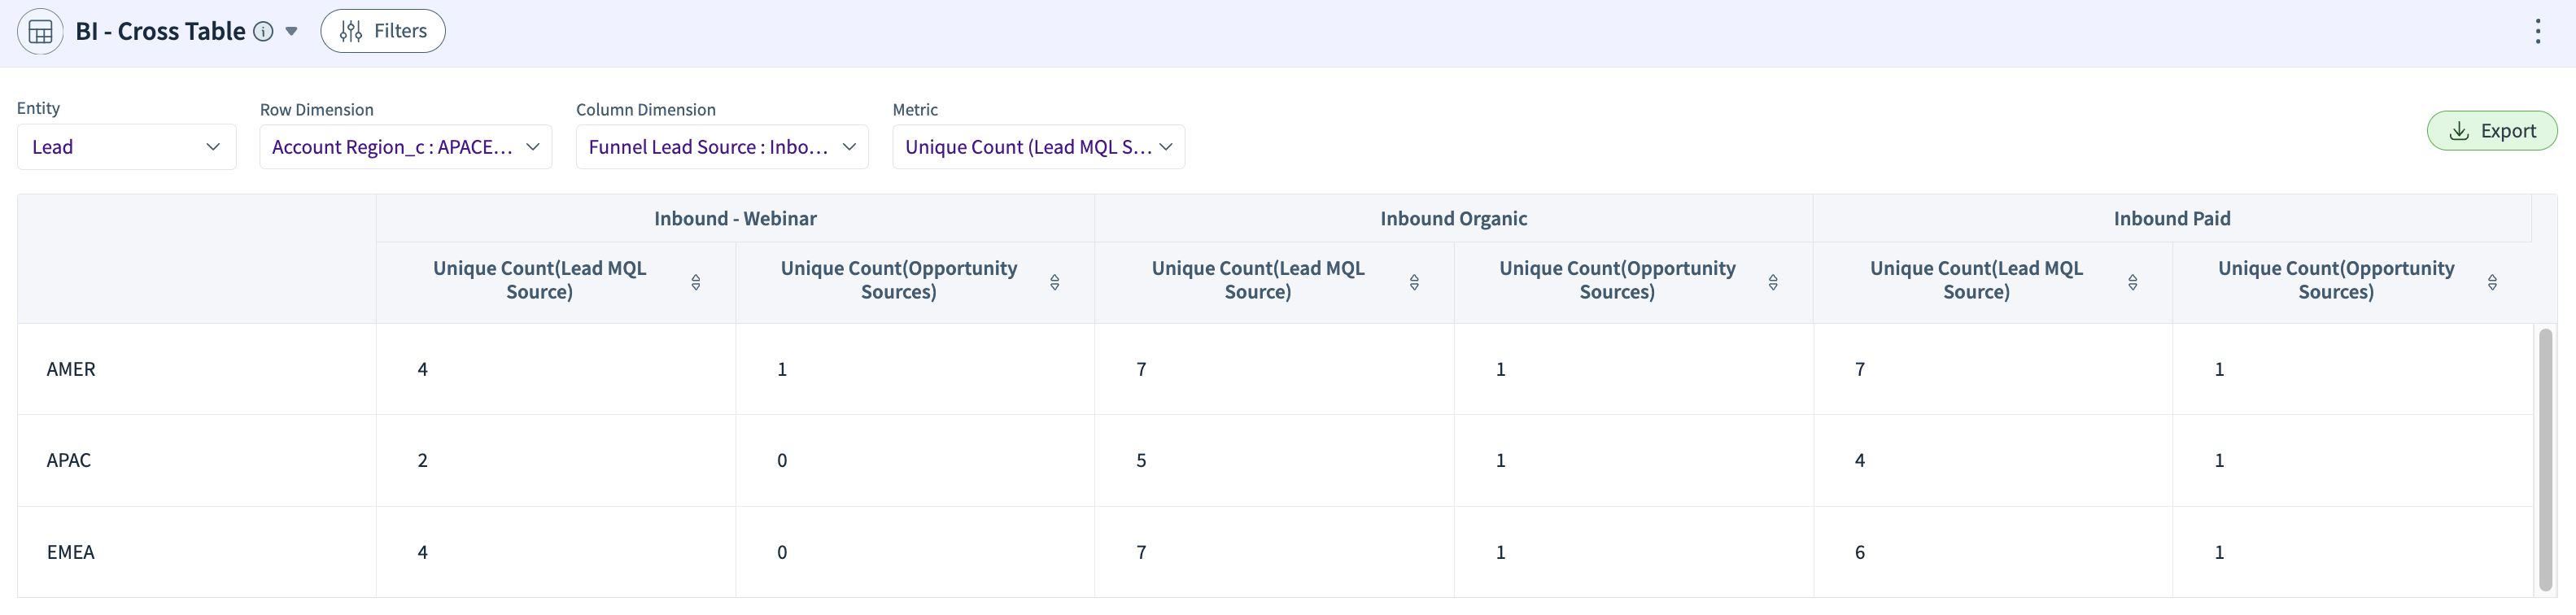
Compare data side by side in a table to find patterns, such as lead generation by funnel source and conversion rates by channel.