1. Overview
What It Is
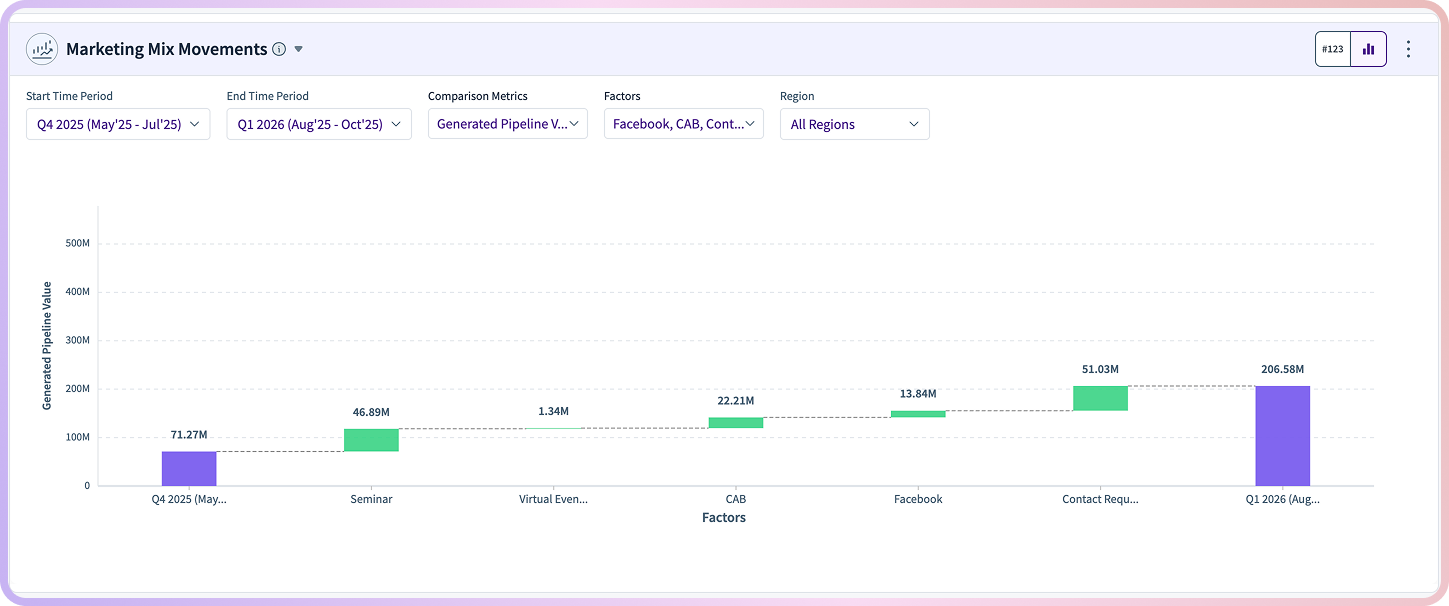
The Marketing Mix Movements (MMM) widget helps explain why a metric—like pipeline value—went up or down between two time periods. It breaks the change into pieces and shows how different marketing drivers (channels, campaigns, regions, etc.) contributed. You’ll see this in both a waterfall chart and an optional table view.
Why It Matters
Marketing and RevOps teams often know what changed, but not why. This widget surfaces the biggest movers, highlights what worked or slipped, and makes it easier to act on the insights. It’s beneficial when prepping for QBRs, diagnosing dips, or deciding where to shift budget.
Use this to answer questions like:
“What caused the pipeline to grow or shrink last quarter?”
“Which channels or activities actually moved the needle?”
2. Who Is It For?
Persona | What They Need |
|---|---|
VP/Director of Demand Gen | A clear, directional view of what’s working. |
RevOps / Marketing Ops | A breakdown of change by specific factors. |
Performance Marketers | Channel-level clarity to guide optimization. |
CMO / Revenue Leaders | A strategic view into what’s driving pipeline shifts. |
3. Key Features
Visual Waterfall Breakdown
Shows positive vs. negative impact for each factor.
Green = lift, Red = drop.
Hover to see exact contribution amounts.
Tabular Breakdown
Numeric values for each contribution.
Color-coded cells (same green/red logic).
Horizontal scrolling for wide datasets.
Flexible Filters
Time period (start vs. end).
Metric selection (e.g., Spend, Pipeline).
Region filters (NA, EMEA, Global).
Factor selection (channels, campaign types, etc.).
Chart ↔ Table Toggle
Switch between visual and numeric views depending on how you prefer to analyze.
4. Technical Implementation Details
How It Works
RevSure’s AI-driven multivariate regression engine powers the widget.
It uses historical performance and attribution data to calculate how much each factor influenced the change in your selected metric.
The core logic is simple:
Metric at End = Metric at Start + Sum of All Factor Contributions
5. How to Use It (Step-by-Step)
Step 1: Pick Your Time Periods
Choose the start and end periods. The end period must be the same or later.
Step 2: Select Metrics & Regions
Select the metric you want to analyze and apply region filters if needed.
Step 3: Choose Factors
Include all factors or narrow down to specific channels like Paid Search, ABM, Events, etc.
Step 4: Read the Waterfall Chart
The height of each bar shows how much a factor moved the metric.
Green = positive impact; Red = negative.
Hover to view exact contribution values.
Step 5: Switch to Table View (Optional)
If you prefer numbers, toggle to the tabular version. Scrolling is available for wide data.
6. Common Use Cases
Scenario | How MMM Helps |
|---|---|
Pipeline dipped quarter-over-quarter | Pinpoints which channels or regions drove the decline. |
Planning budget shifts | Reveals which investments historically made the biggest difference. |
QBR preparation | Provides a clean story of what drove performance changes. |
Investigating a regional drop | Breaks down change by both region and factor. |
Comparing performance (e.g., ABM vs Paid Social) | Use filters to isolate and compare channels. |
7. Related RevSure Modules
Marketing Mix Modeling: Long-term contribution modeling and ROI planning.
Campaign Reallocation: Automated suggestions for budget shifts.
Demand Generation Effectiveness: Deep attribution across channels.
Pipeline Health & Projections: See how changes affect the downstream pipeline.