Introduction
This module helps you understand how your marketing channels impact pipeline and booking generation. You can analyse factors influencing your pipeline and booking, such as macroeconomics, marketing investments, KPIs, etc. Using this module, you can identify the most effective activities within your marketing mix, which helps you strategize and maximize your marketing ROI.
Marketing Mix Modelling enables optimal spend allocation, strategic adjustments, and enhanced ROI, ensuring your marketing efforts drive maximum value. This module also helps you visualize baseline and channel contributions to your pipeline and bookings, track overall performance, and analyse spending, campaigns, impressions, pipeline, and booking metrics.
Filters
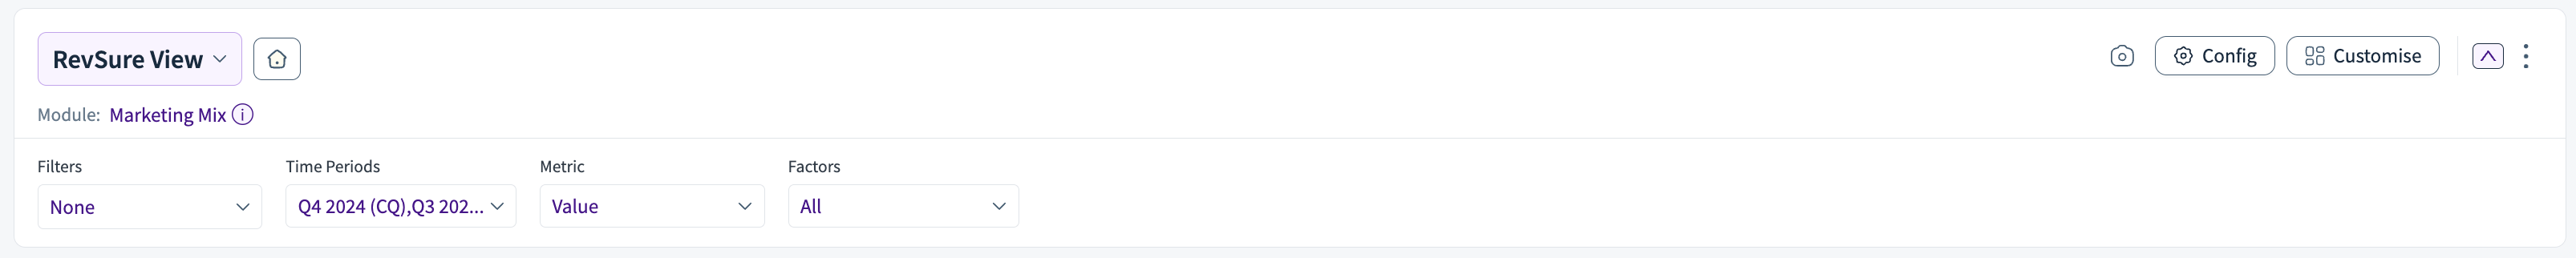
Use the filters to filter the data and period for which you want to perform marketing mix modelling. The following options are available:
Filters: Filter by various data dimensions available to you.
Time Periods: Choose the quarter and year for which you want to perform the modelling.
Metric: Choose if you want to view the metrics on the module in terms of ‘Volume’ or ‘Value’
Factors: Choose the factors from the list. These are the factors from the ‘Feature Group Name’ that have been configured in the ‘Definition & Feature Groups’ section.
Config
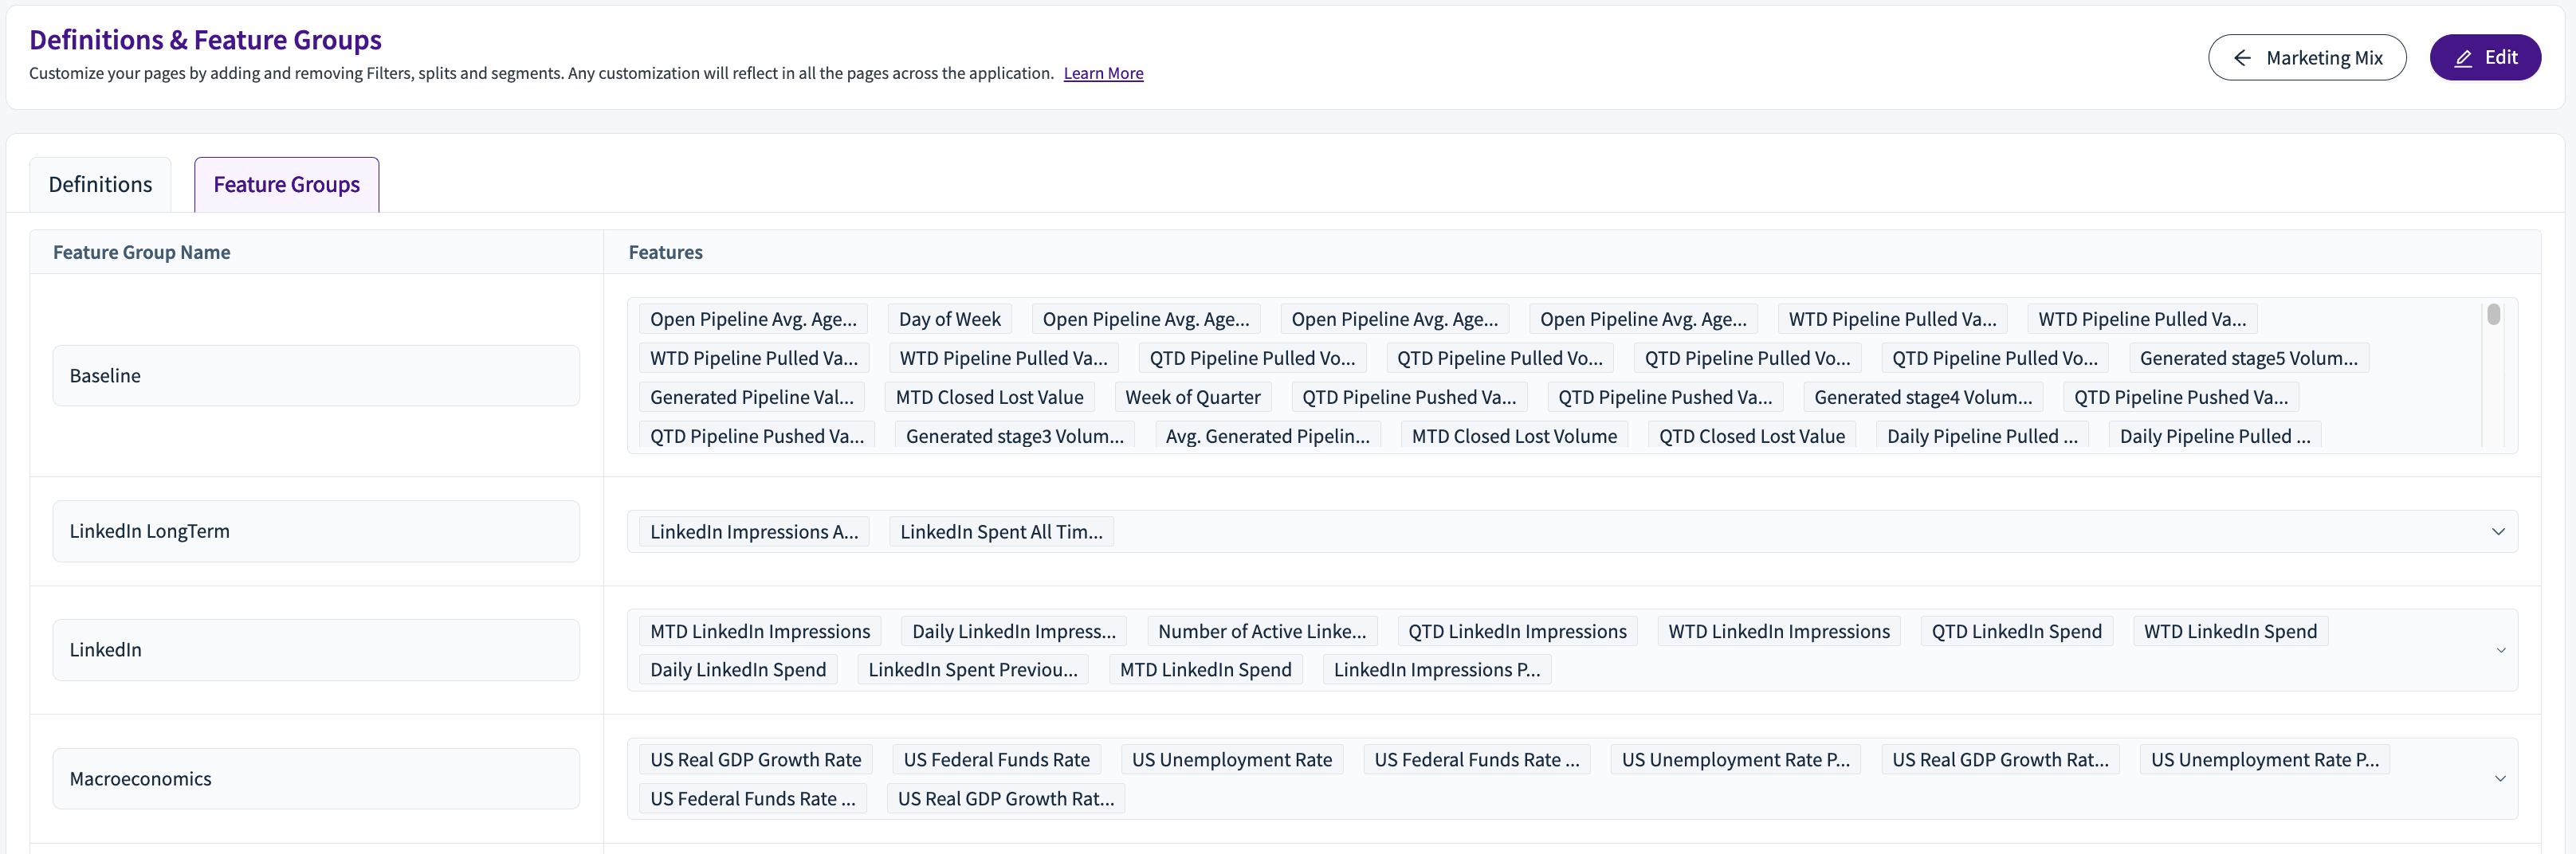
From the Marketing Mix module, we can click on the ‘Config’ button and go to the ‘Definition & Feature Groups’. Over here, we can create various feature groups and add various data dimensions to each of them. Based on this config, the feature group names will be the factors for the marketing mix modelling, and the same will be seen in the charts and widgets.
Customize
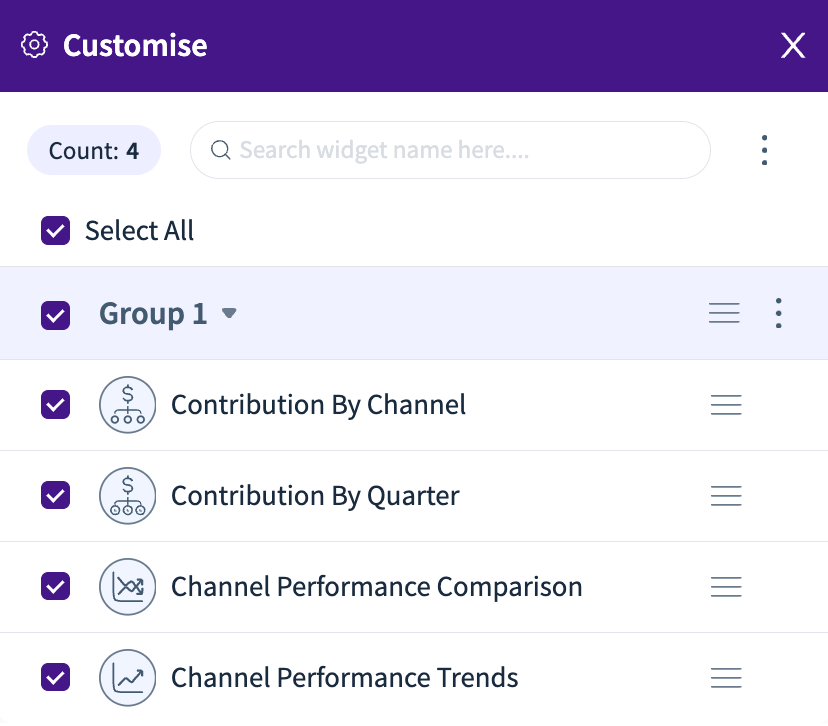
You can use the ‘Customize’ side pane to choose which widgets to add to the view. The widgets below are available and are explained in the subsequent subsection:
Contribution by Channel
Contribution by Quarter
Channel Performance Comparison
Channel Performance Trends
Contribution by Channel
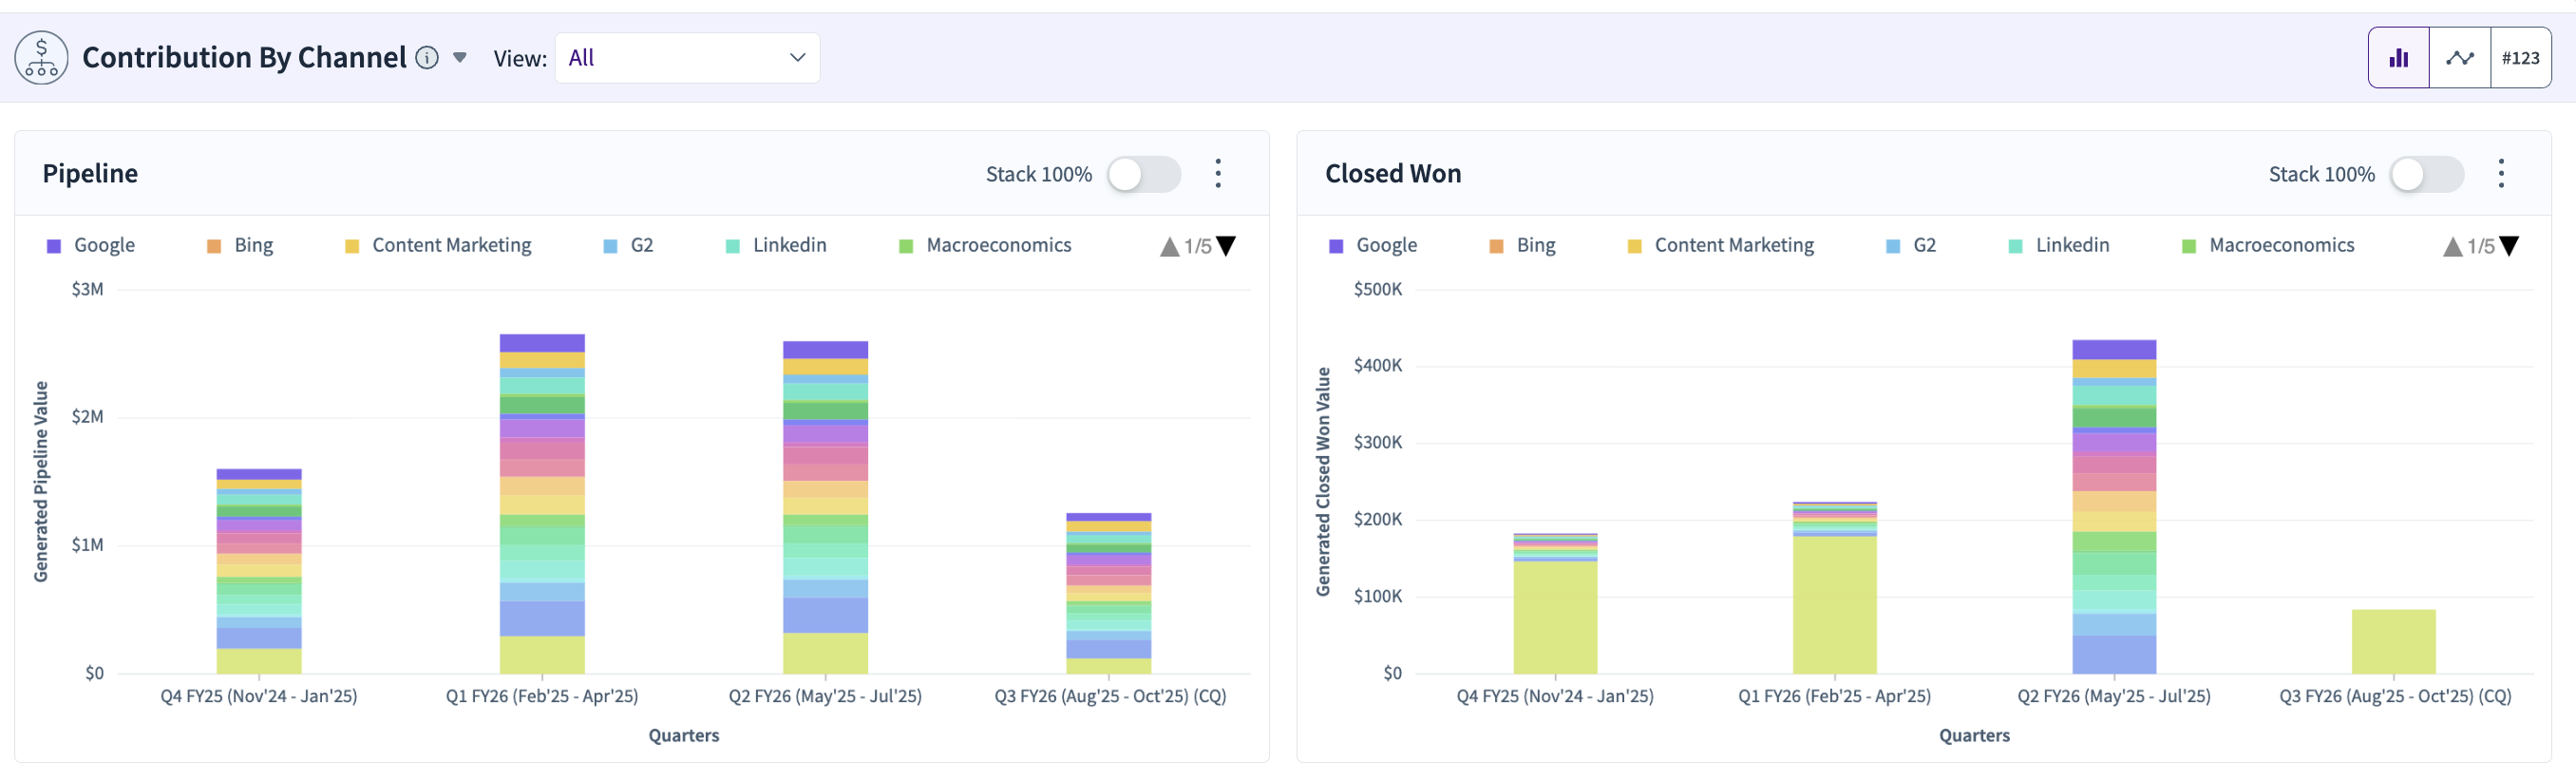
This widget shows how the various factors are impacting the pipeline as well as the bookings over time. You can view the charts as bar charts or as a trend line chart.
Contribution by Quarter
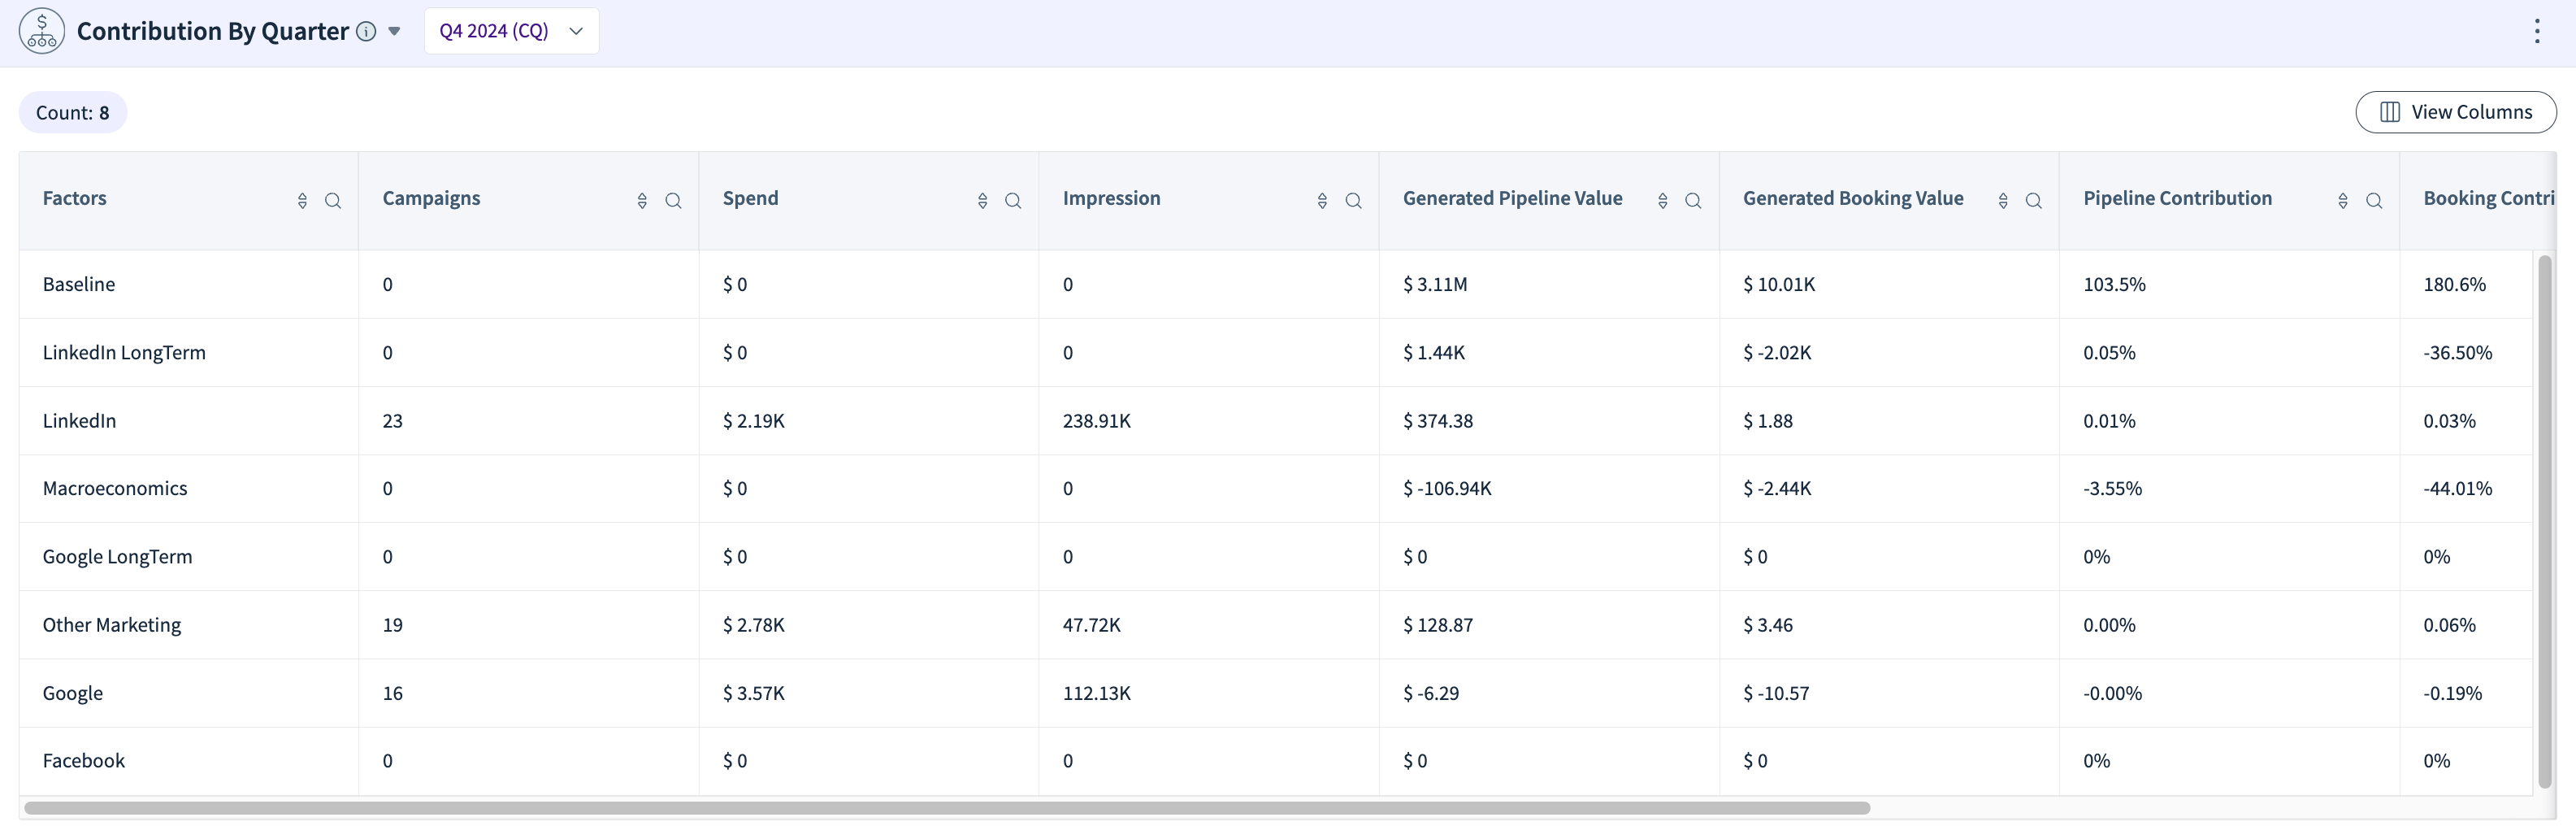
This widget shows you the contribution of each factor for a selected quarter. You can choose from the following metrics to view for each factor:
Campaigns
Spend
Impression
Generated Pipeline Value
Generated Booking Value
Pipeline Contribution
Booking Contribution
Pipeline ROI
Booking ROI
Channel Performance Comparison
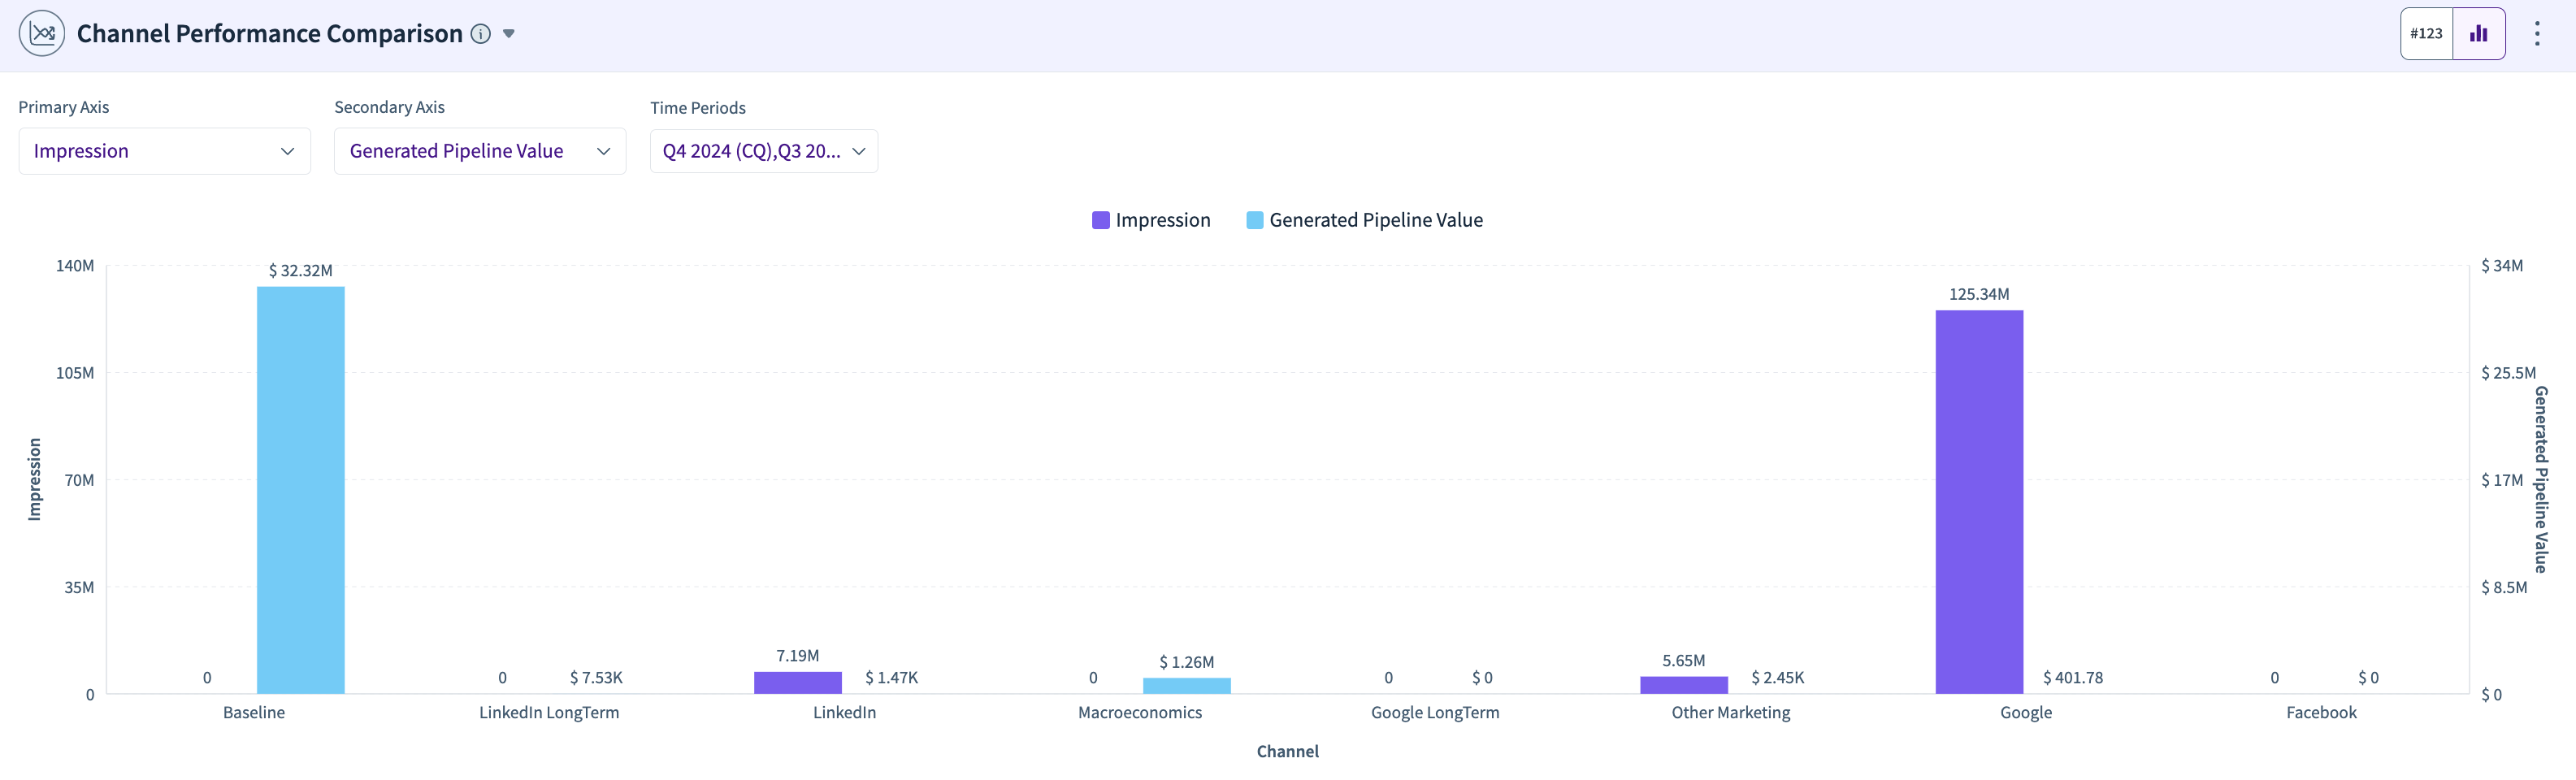
This widget allows you to plot two metrics next to each other for every factor. You can use the ‘Primary Axis’ and ‘Secondary Axis’ dropdowns to choose the desired metrics. Additionally, use the ‘Time Periods’ dropdown to select one or more quarters that need to be considered. If multiple quarters are chosen, the values for each metric for the selected quarters are aggregated for each factor.
Channel Performance Trends
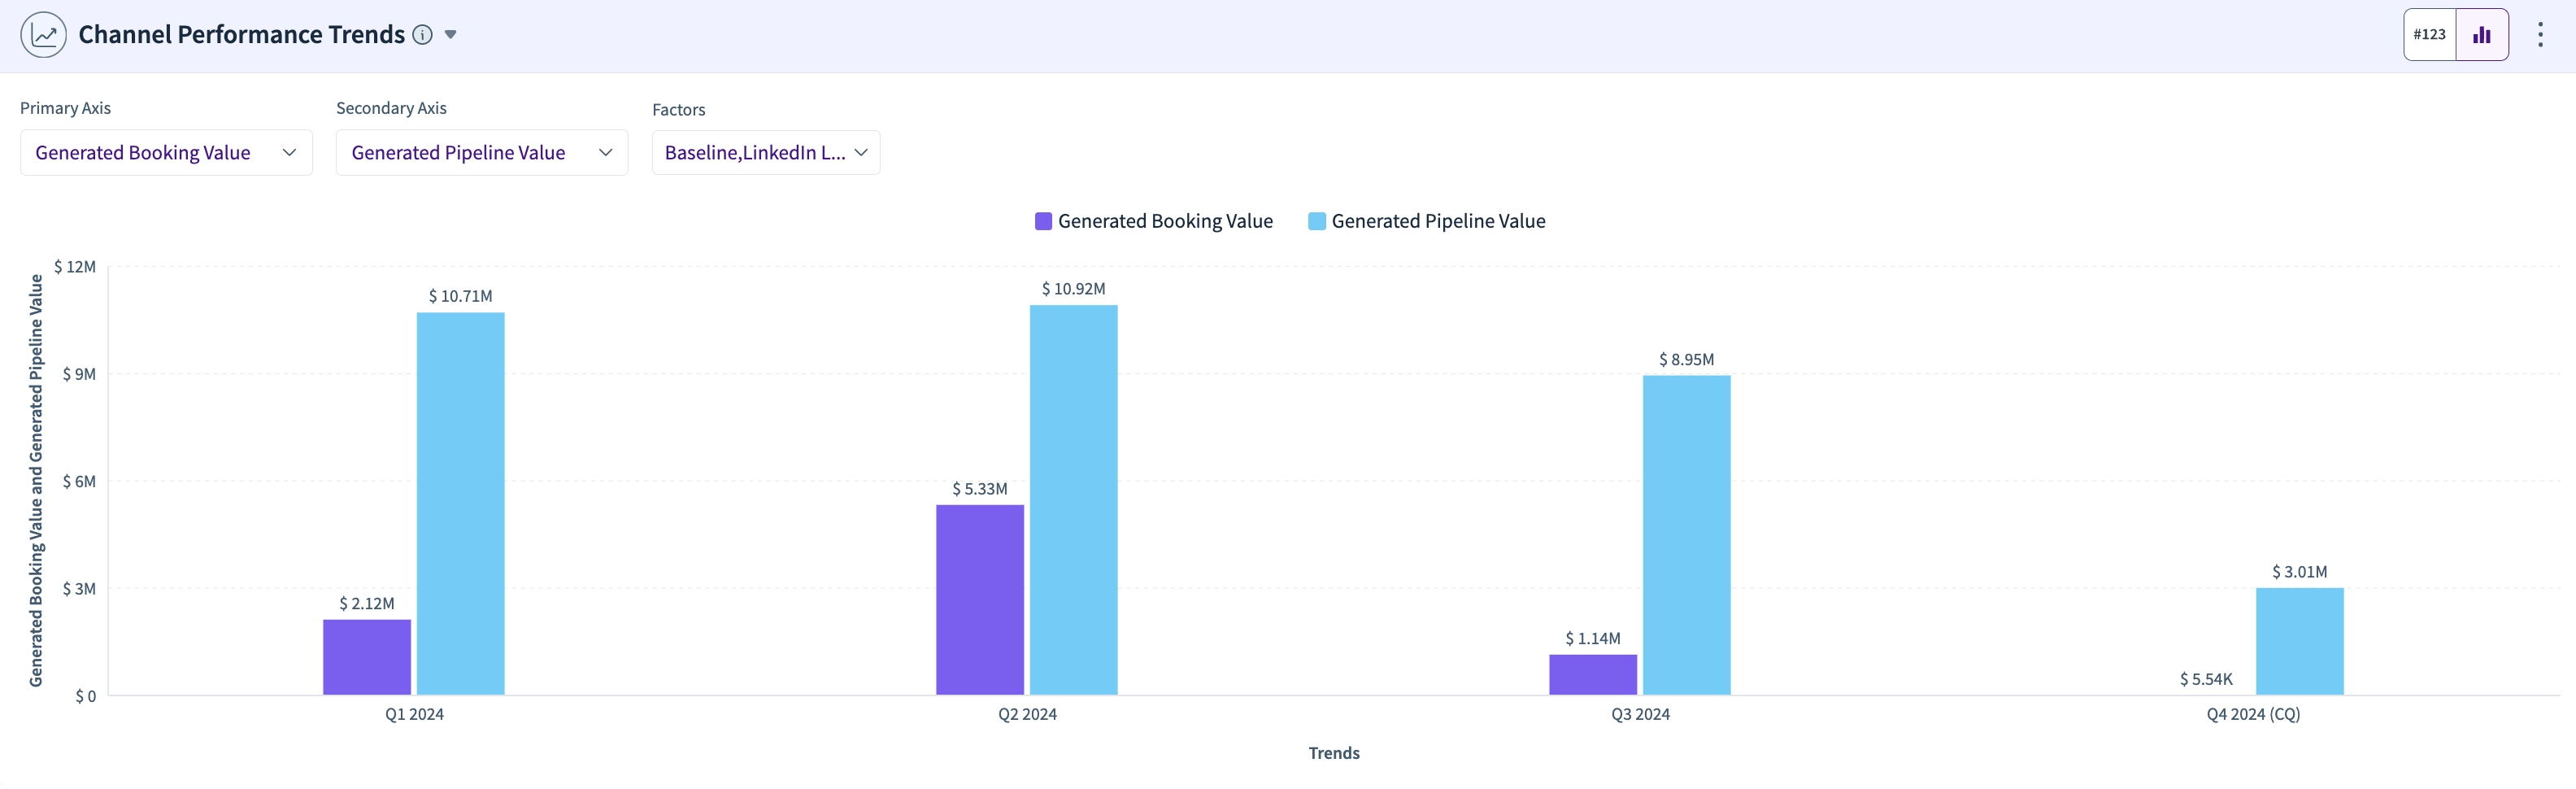
This widget allows you to plot two metrics next to each other for every quarter. You can use the ‘Primary Axis’ and ‘Secondary Axis’ dropdowns to choose the desired metrics. Additionally, use the ‘Factors’ dropdown to select one or more factors that need to be considered. If multiple factors are chosen, the values for each metric for the selected factors are aggregated for each quarter.