The Journey module helps you unearth the most promising journeys that a lead takes as they progress through the stages in the funnel. It also helps you uncover any roadblocks your leads may encounter in their journeys. The Journey module is where you can analyse the journeys/activities/engagements in various ways using different combinations of multiple filters. You will also see the campaign(s) with which a lead may have interacted. Using the Journey module, you can trace the most important touches and conversion paths from anonymous visits to pipeline & revenue.
Filters
.png)
This section lets you choose various data dimensions and other parameters to analyse the customer journeys.
Filters
Allows you to apply filters for specific criteria to narrow down the data being analyzed. Select the data dimensions from the dropdown for analysis.
Analysis Type
There are four types of journey analysis that you can perform, as listed below:
Created: Perform the journey analysis based on when a lead was first created in a stage of the funnel
Progressed: Perform the journey analysis based on when a lead/opp progressed from one stage to another
All Leads: Perform the journey analysis based on all the leads, irrespective of the stage. There are two engagement criteria for this:
First engagement: Look at the journeys of all leads having their first engagement in the selected period
Any engagement: Look at the journeys of all leads having any engagement in the selected period
All Accounts: Perform the journey analysis based on all the accounts, irrespective of the stage.
Created Time Period
You can select the period when the lead was created. Below are all the presets that are present, along with a ‘custom’ option that lets you choose a desired time period.
Days: Allows users to select a time period measured in days for data creation.
Weeks: Provides options to select a time period measured in weeks.
Months: Enables users to select a time period measured in months.
Quarters: Allows for the selection of a time period based on fiscal or calendar quarters.
Years: Provides options to select a time period measured in years.
All Time: Includes all dates starting from the very first available date in RevSure.
Custom: Allows users to define a specific custom time range for data creation
Created Stage
You can use this dropdown to select the starting point of the journey. Below are the various commonly available funnel stage options, although you may see a different list based on the configurations for your organization.
Pre-Lead: Refers to all interactions that happened before a lead. Applicable only to the Journey module’s Progressed Analysis type, to capture engagements and campaign touches that happened before the lead was formally created.
Lead: Indicates initial contact with a potential customer who has shown interest.
MQL (Marketing Qualified Lead): Prospects who have been vetted by marketing and are deemed likely to become customers.
Pre-SAL: Refers to potential sales accepted leads before formal sales acceptance.
SAL (Sales Accepted Lead): Leads that have been accepted by the sales team for further action.
SQL (Sales Qualified Lead): Leads that have been qualified by the sales team and are ready to enter the sales pipeline.
Since this dropdown is used to select the starting stage of the journey, the last stage of the funnel will not be available in the list.
Progressed Time Period
This is similar to the ‘Created Time Period’ options. Using this option, you can specify the time window within which the movement should have happened from the ‘Created Stage’ to the ‘Progressed Stage’.
Progressed Stage
You can use this dropdown to select the ending point of the journey. Below are the various commonly available funnel stage options, although you may see a different list based on the configurations for your organization.
Lead: Initial contact with a potential customer who has shown interest.
MQL (Marketing Qualified Lead): Prospects vetted by marketing and deemed likely to become customers.
Pre-SAL: Potential sales accepted leads before formal sales acceptance.
SAL (Sales Accepted Lead): Leads accepted by the sales team for further action.
SQL (Sales Qualified Lead): Leads qualified by the sales team and ready to enter the sales pipeline.
Closed Won: Deals that have been successfully closed and converted into sales.
Since this dropdown is used to select the ending stage of the journey, the first stage of the funnel will not be available in the list.
Contacts Considered
You can choose one of the three options to consider the contacts for the journey analysis:
All contacts in Account: Consider all contacts associated with the account
Primary contact in Opportunity: Consider only the primary contact associated with an opportunity
All contacts in Opportunity: Consider all the contacts associated with an opportunity
Visualization Filters
.png)
Engagement
You can use this dropdown to select the type of engagement the lead had with the campaign. The available options are:
Activity: Tracks various activities related to customer engagement, such as interactions or events.
Campaign Touch: Monitors touches or interactions initiated through marketing campaigns.
Funnel Movement: Observe the movement of leads through different stages of the sales funnel.
Source
Select the data source(s) of the leads/opportunities that you want to use for the journey analysis. Some common examples are Marketo, Salesforce, Google Ads, etc.
Journeys By
You can use these options to group and view the journeys. The two options presented are:
Engagement Type: Group journeys based on the type of engagement, such as email, call, or website visit
Engagement Name: Groups journeys by the specific name or title of the engagement email, such as the email header, call description, or a specific page on the website
Start With
You can use this dropdown to select the starting engagement or activity to see only the journeys that start with that engagement.
End With
You can use this dropdown to select the ending engagement or activity to see only the journeys that end with that engagement.
Has Any
You can use this dropdown to select engagements to see the journeys that have them anywhere within the journey.
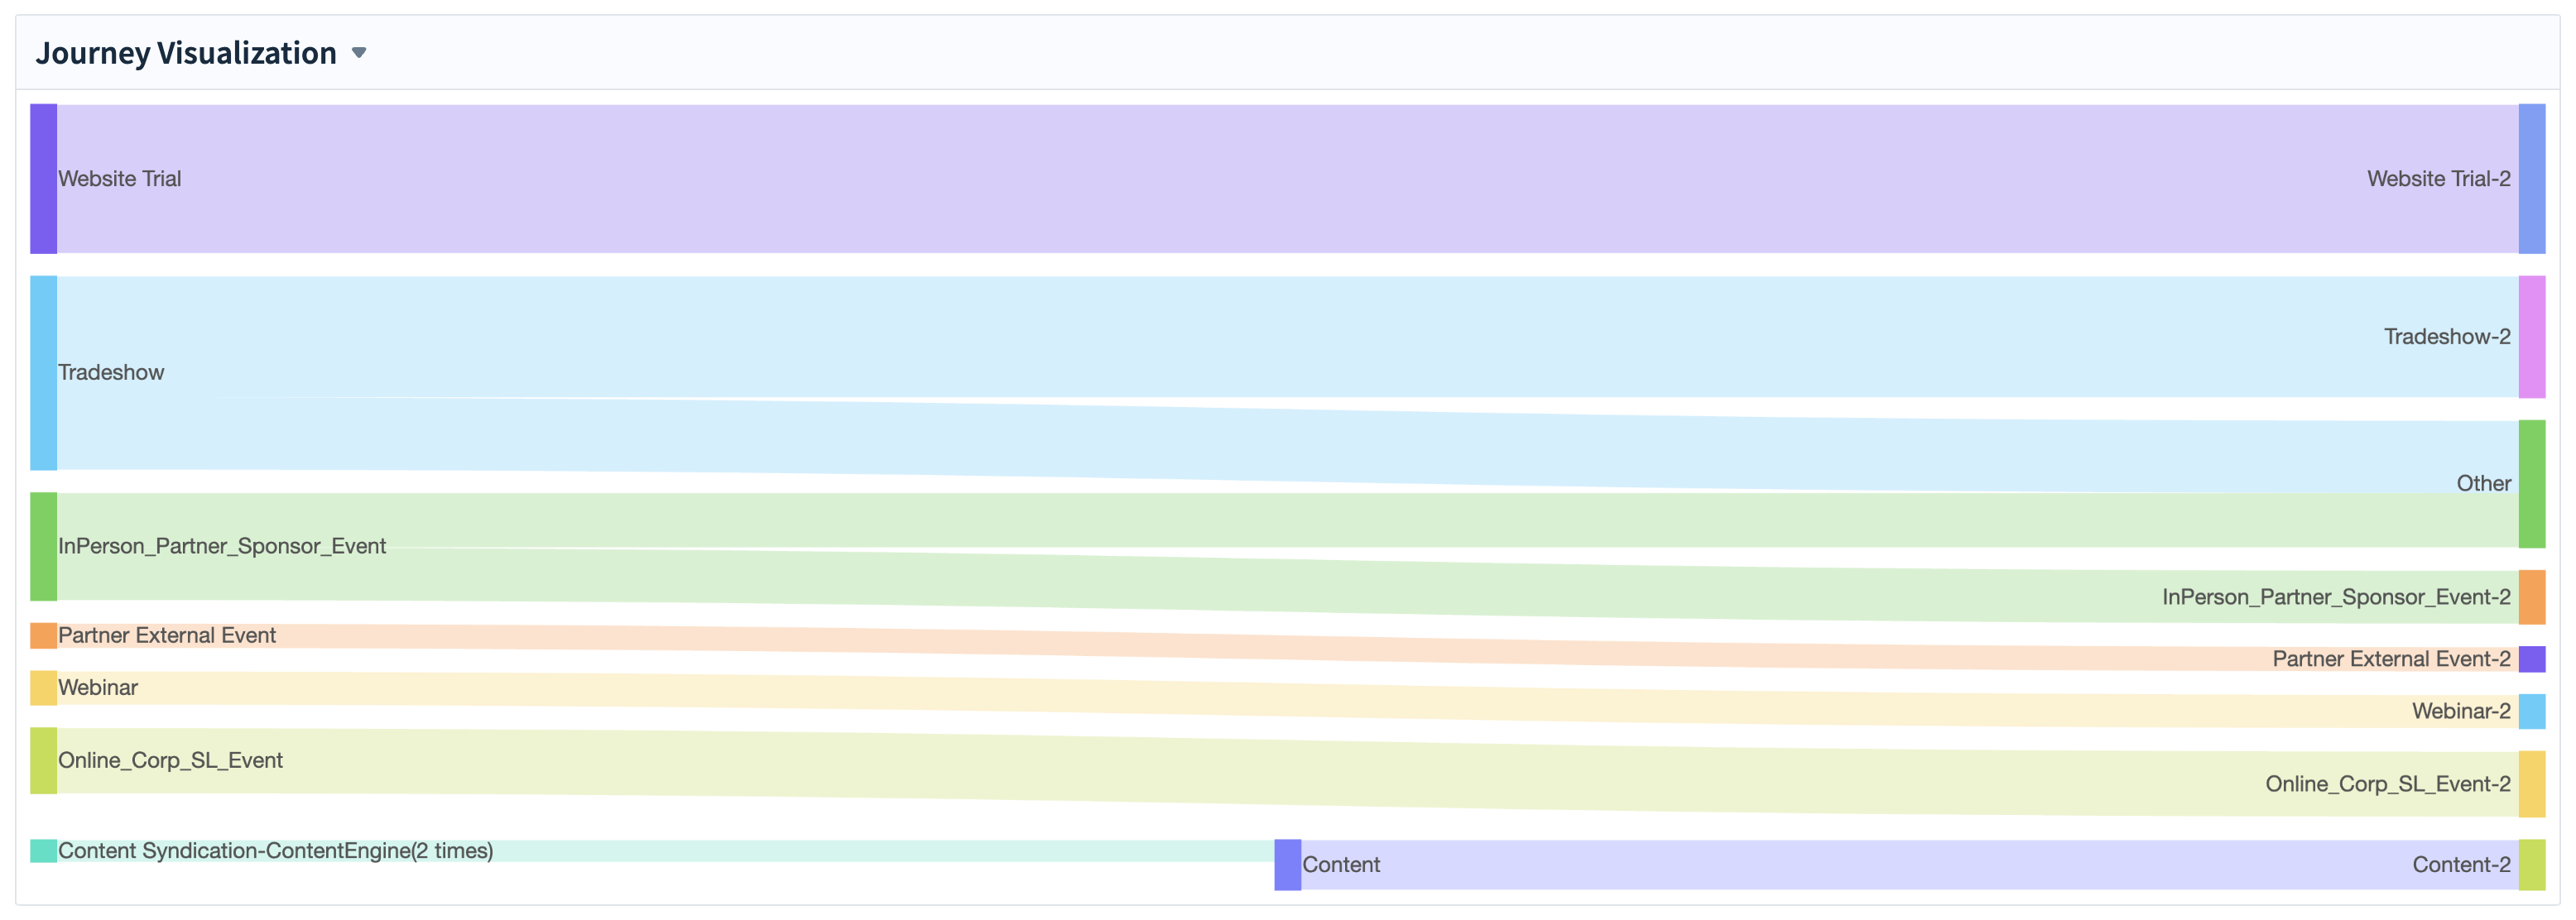
Visualization Chart
Based on the options chosen in the sections above the chart, the chart gets populated with various journeys. You can hover on the various journeys to see more details.
Summary
.png)
This section shows the summary of metrics for the journeys that you have selected or filtered for. Below are the various sections of this section:
# of Leads/Opportunities: Total number of leads/opportunities across all the journeys after applying the desired filters
# of Journeys: Total number of journeys completed (for ‘Created’ analysis type) or progressed (for ‘Progressed’ analysis type) or the number of leads (for ‘All Leads’ analysis type).
Avg. Of Steps Across Journeys: The average number of steps taken to complete the journeys.
Avg. Cycle Time (days): The average time in days to complete a journey.
Top 5 Touchpoints Based On: Displays the top 5 touchpoints based on:
Average touches
# Journeys Touched
Table
Journeys
The ‘Journeys’ tab of the table shows you the details of various types of journeys that your leads have undergone. You can select various metrics associated with each type of journey using the ‘View Columns’ menu. It contains the following options:
Avg. cycle time (days): The average time in days to complete a journey
# Steps: Number of engagements in the journey
Number of Leads/Opportunities/Accounts: This is based on the ‘Analysis Type’ selected and the ‘Progressed Stage’. It shows the number of leads/opportunities/accounts that have undertaken that journey.
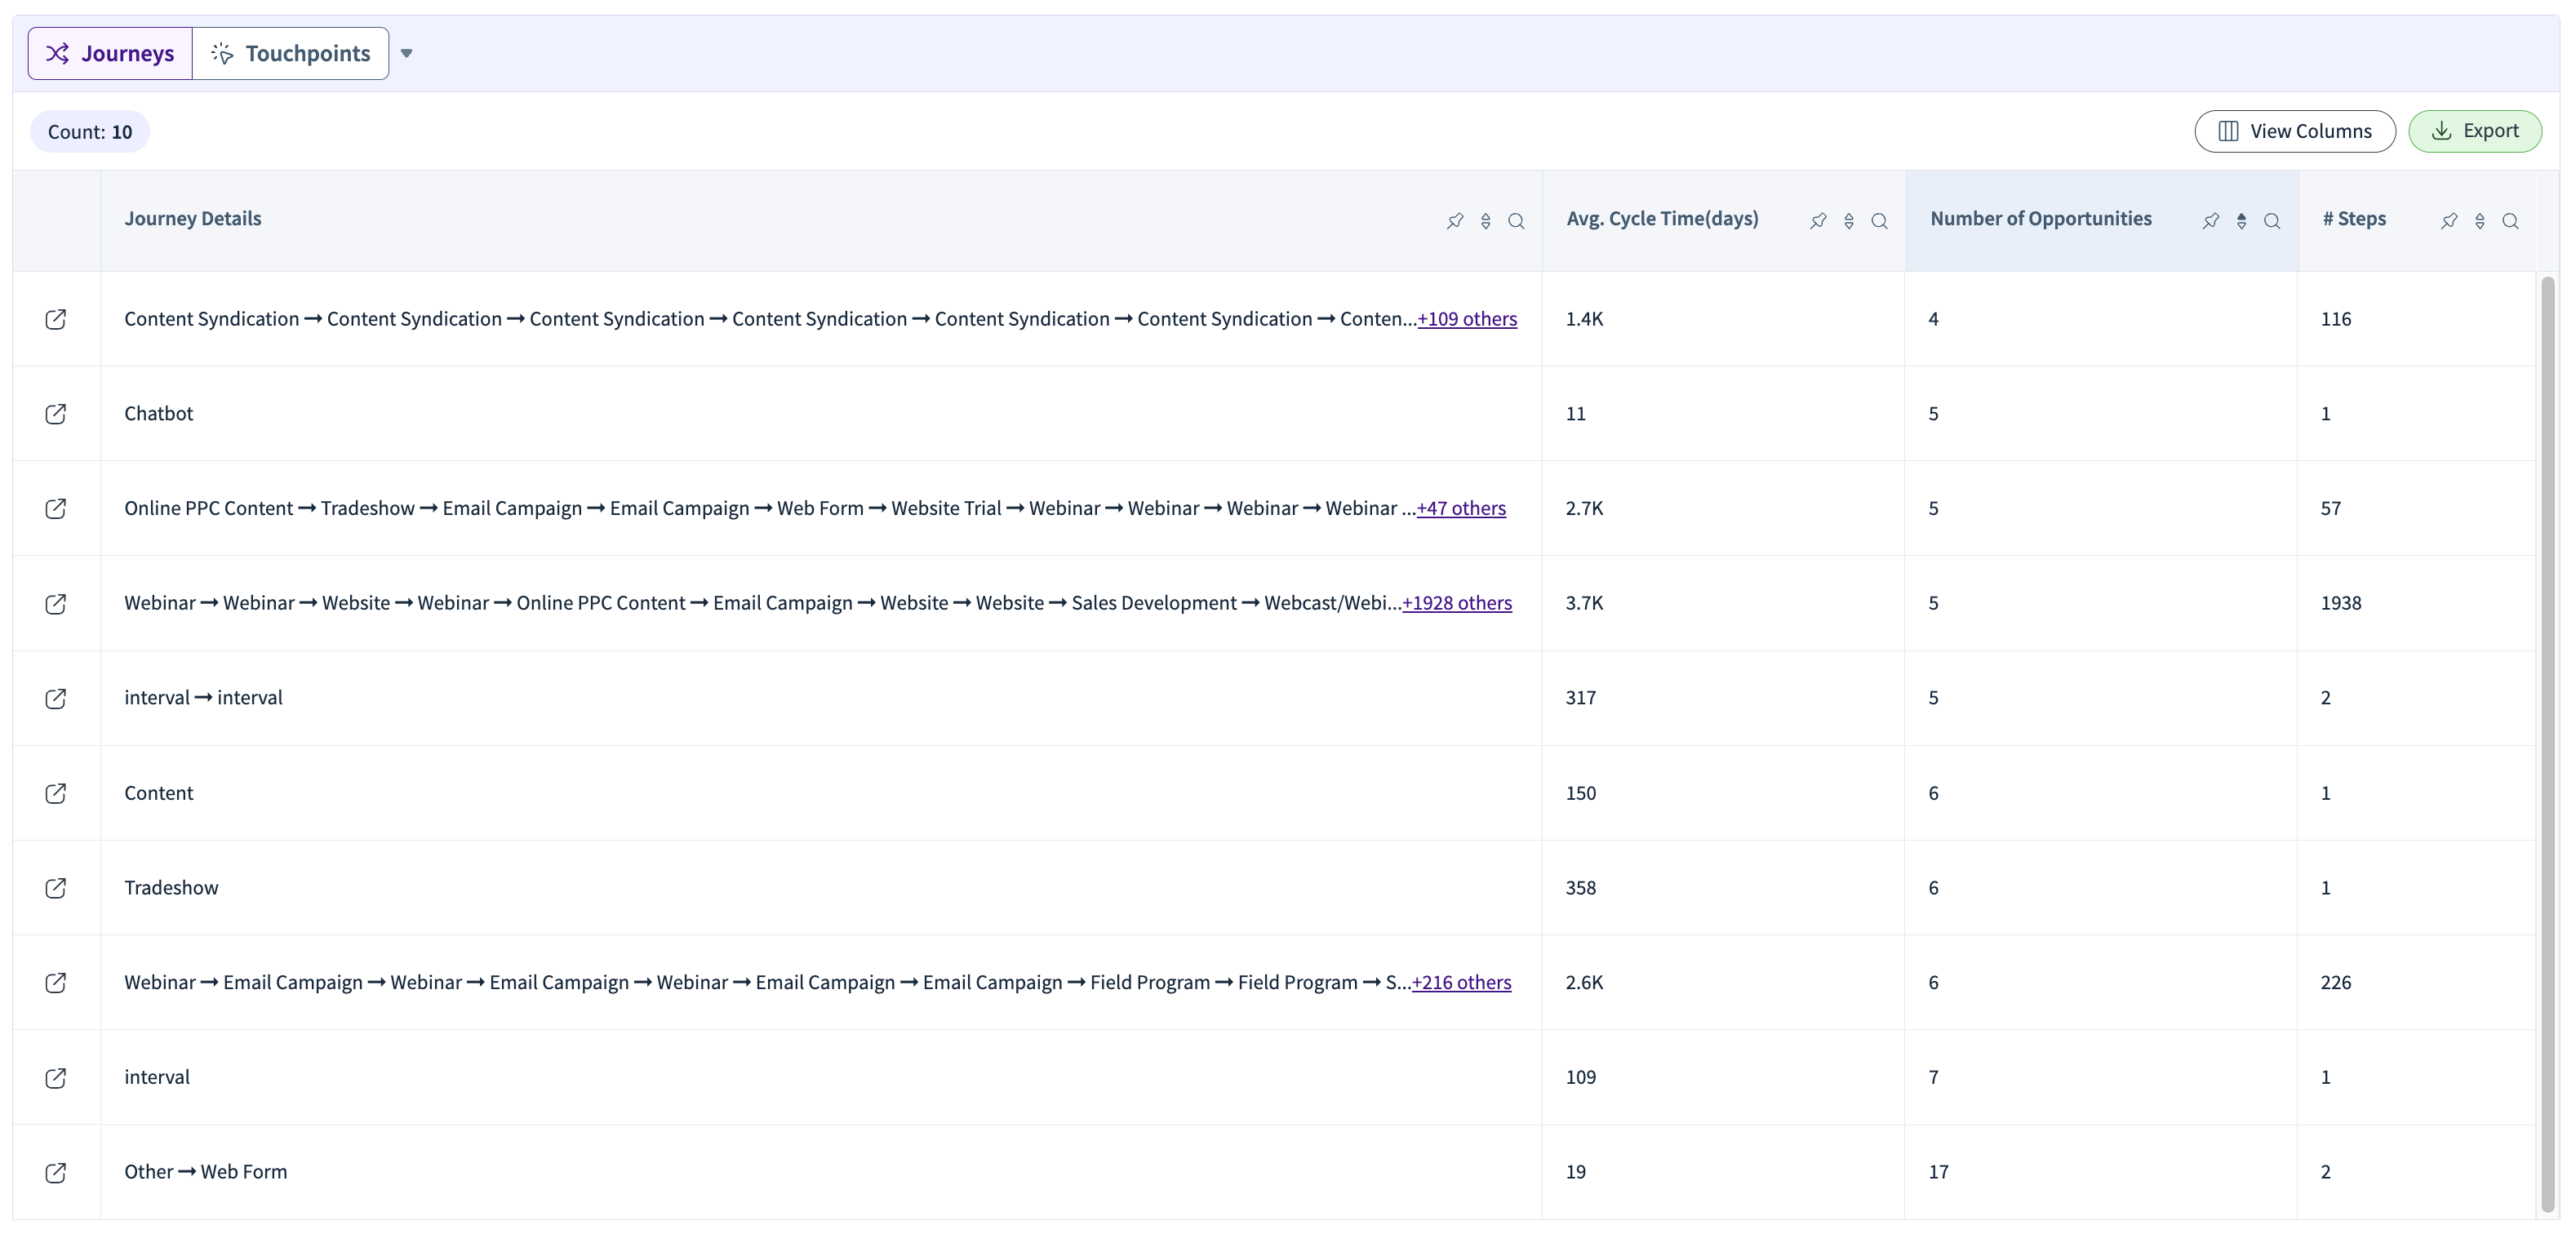
When you click the icon at the start of any row, a side panel will open showing you the details of all the leads that undertook that journey.
.png)
You can further drill down and look at the exact Journey Timeline with engagements and timestamps for each row item by clicking on the ‘Journey Timeline’ icon. You also have a few filter dropdowns to further refine the journey timeline view as you desire.
.png)
Touchpoints
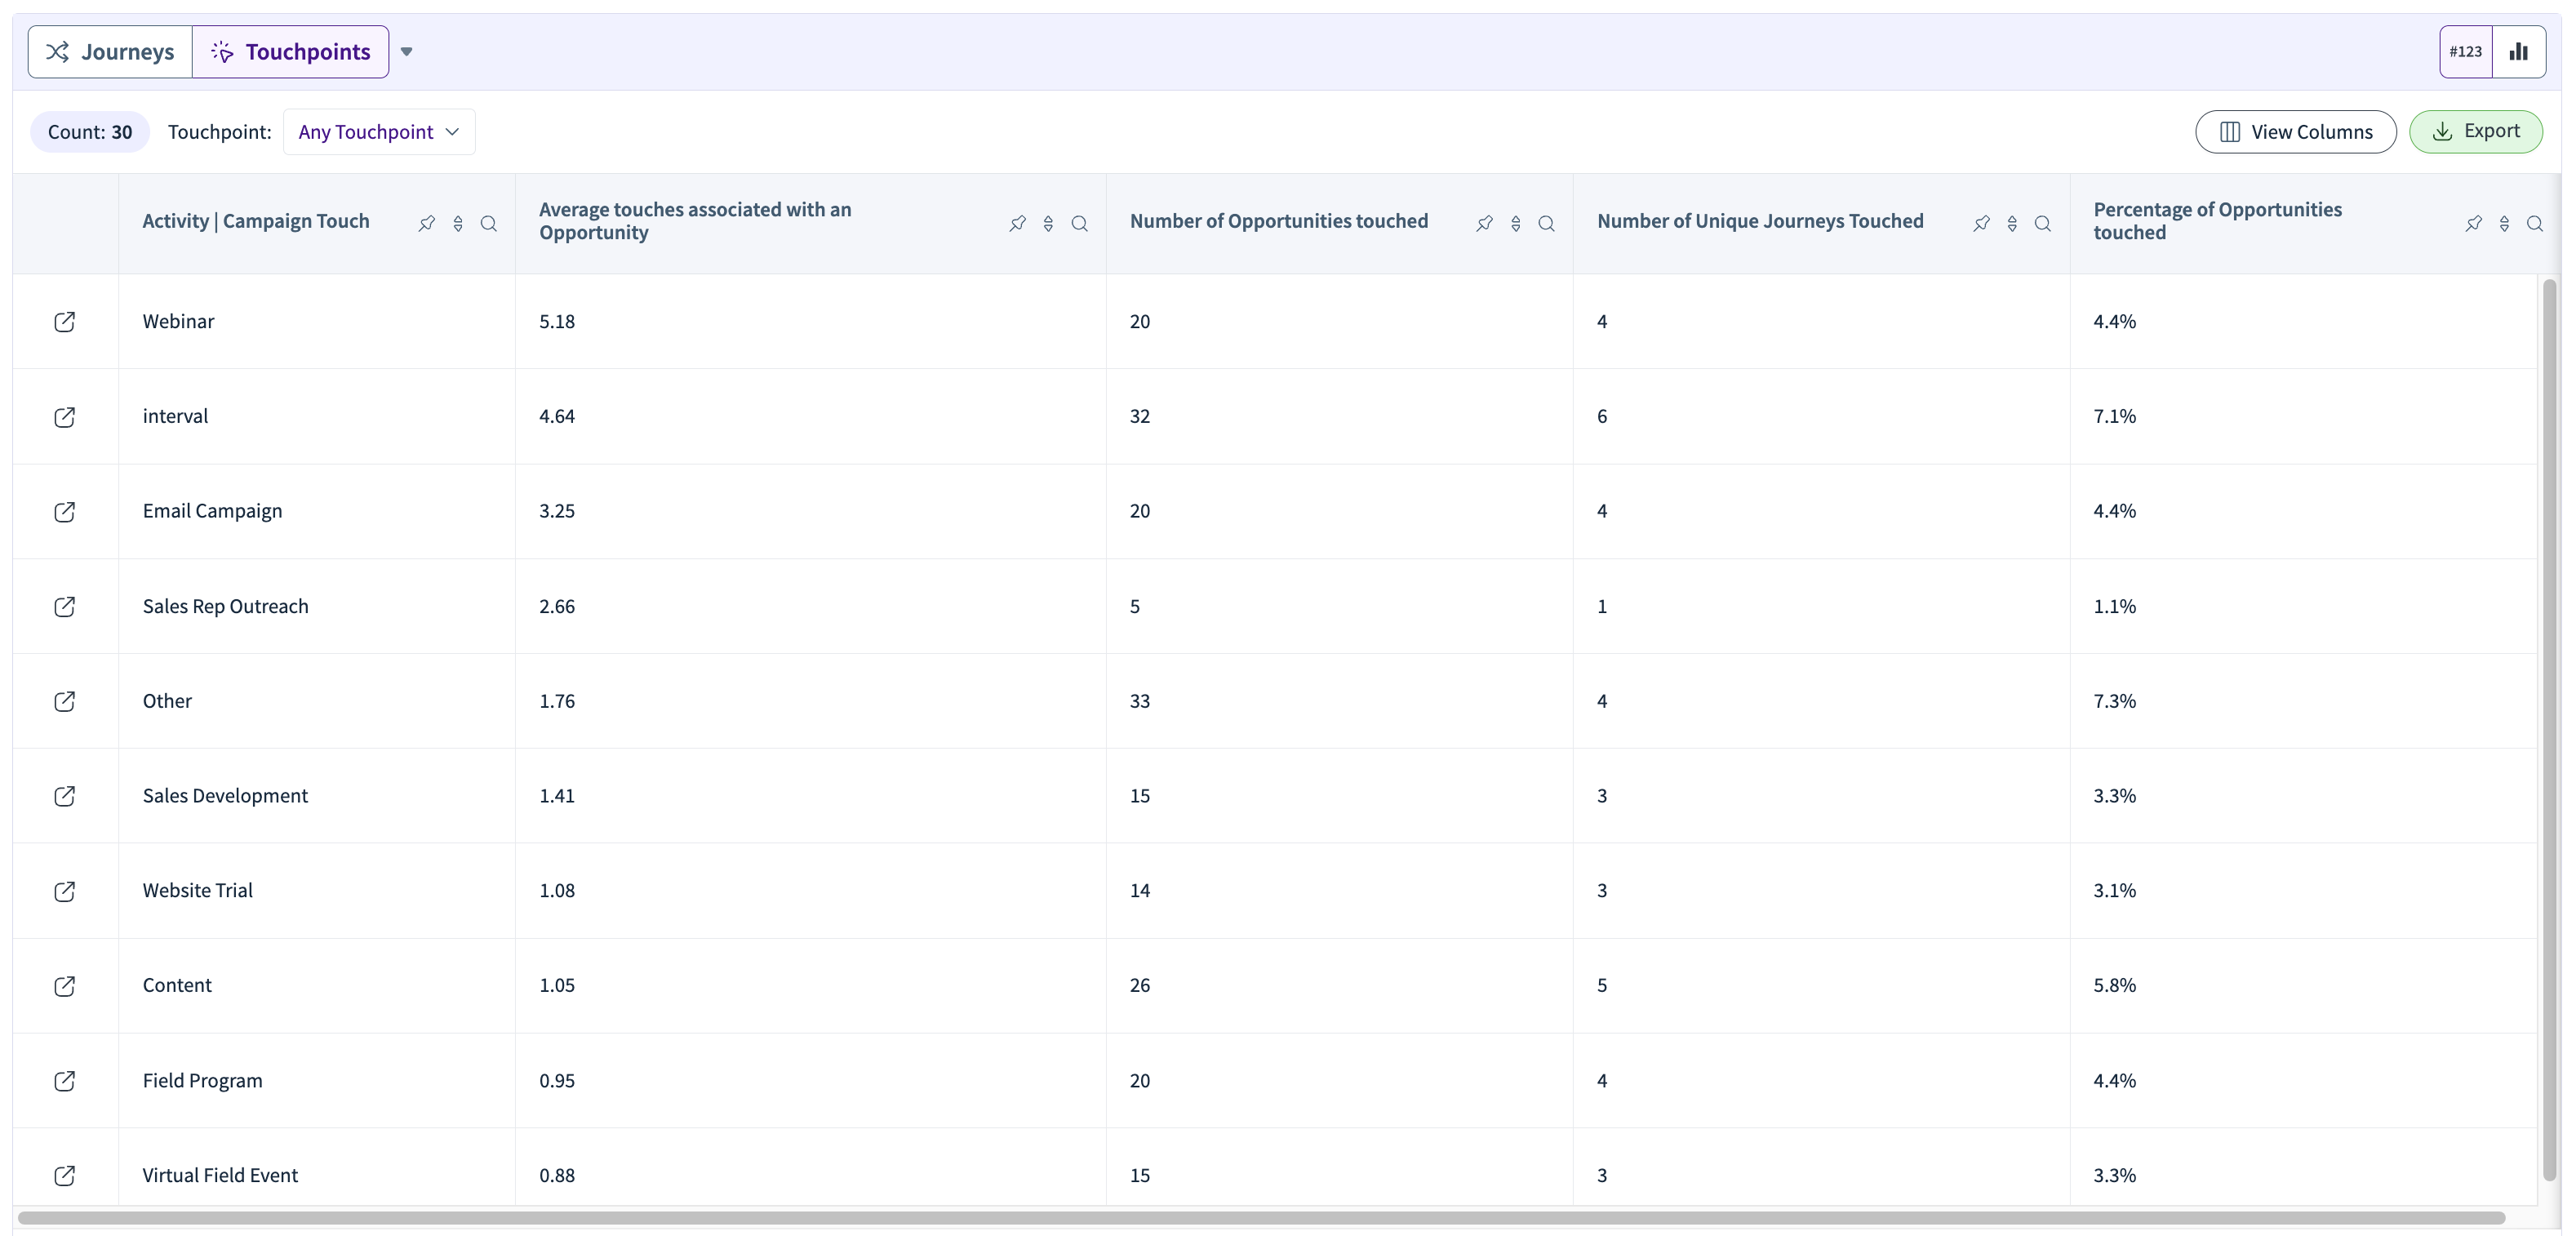
The ‘Touchpoints’ tab of the table shows you the impact of the various types of touchpoints (activities/campaign interactions) present in all the journeys. It also has details about the touchpoints, such as:
Average touches associated with a Lead/Opportunity/Account: This measures the average number of interactions or touches recorded within a lead’s/opportunity’s/account’s journey.
Number of Leads/Opportunities/Accounts Touched: This indicates the total number of unique lead/opportunity/account journeys that have experienced at least one touchpoint or interaction.
Percentage of Leads/Opportunities/Accounts Touched: This represents the percentage of all lead/opportunity/account journeys that have been touched by a specific activity or campaign.
Number of Unique Journeys touched: Number of Unique Journeys where the touchpoint has appeared
Total Number of Touches in all Journeys: Total Number of Touches of that touchpoint across all the Journeys
When you click the icon at the start of any row, a side pane will open, showing you the details of that particular touchpoint type. You will then be able to see the metrics related to the touchpoint and also the composition list, accompanied by relevant metrics.
.png)
Segment Level Touchpoint Analysis
We can view touchpoint breakdowns by specific attributes ("Split By") directly within the Touchpoints tab at both module and widget levels.
This allows more granular, segment-level insights—e.g., for sponsored events, users can see how touchpoints vary by customer segment, company Size bucket, industry, or any configured dimension.png)