Incrementality testing is a set of statistical methods that measure the true impact of a marketing campaign or activity. RevSure supports the following incrementality testing methods and widgets:
Conversion Lift Analysis
Pre-Post Analysis
Differences in Difference (Test vs Control Group Impact Analysis)
Multivariate Causal Impact Analysis
Campaign Lift Analysis — Across Campaigns
Campaign Lift Analysis — Individual Campaigns
These widgets are available under the Customize side panel of the Marketing Performance module.
Conversion Lift Analysis Widget
This widget measures the statistical validity of conversion differences between two groups:
Control — a particular marketing/GTM activity has not been performed
Test — the marketing/GTM activity has been performed
In RevSure, you identify Control vs. Test groups using a Boolean (true/false) or binary categorical (Y/N) dimension. Examples include Lead Google Touched, Lead LinkedIn Touched, and similar touch flags.
The statistical test used is a chi-squared test of proportions.
Minimum sample size check
Before running the test, RevSure calculates the minimum required sample size per group using a power analysis based on the chi-squared test.
Inputs: expected control and test conversion rates, significance level, and desired statistical power.
This ensures the groups are large enough for the chi-squared approximation to be valid and that the test has sufficient statistical power. If the observed sample size is below this threshold, results are flagged as unreliable.
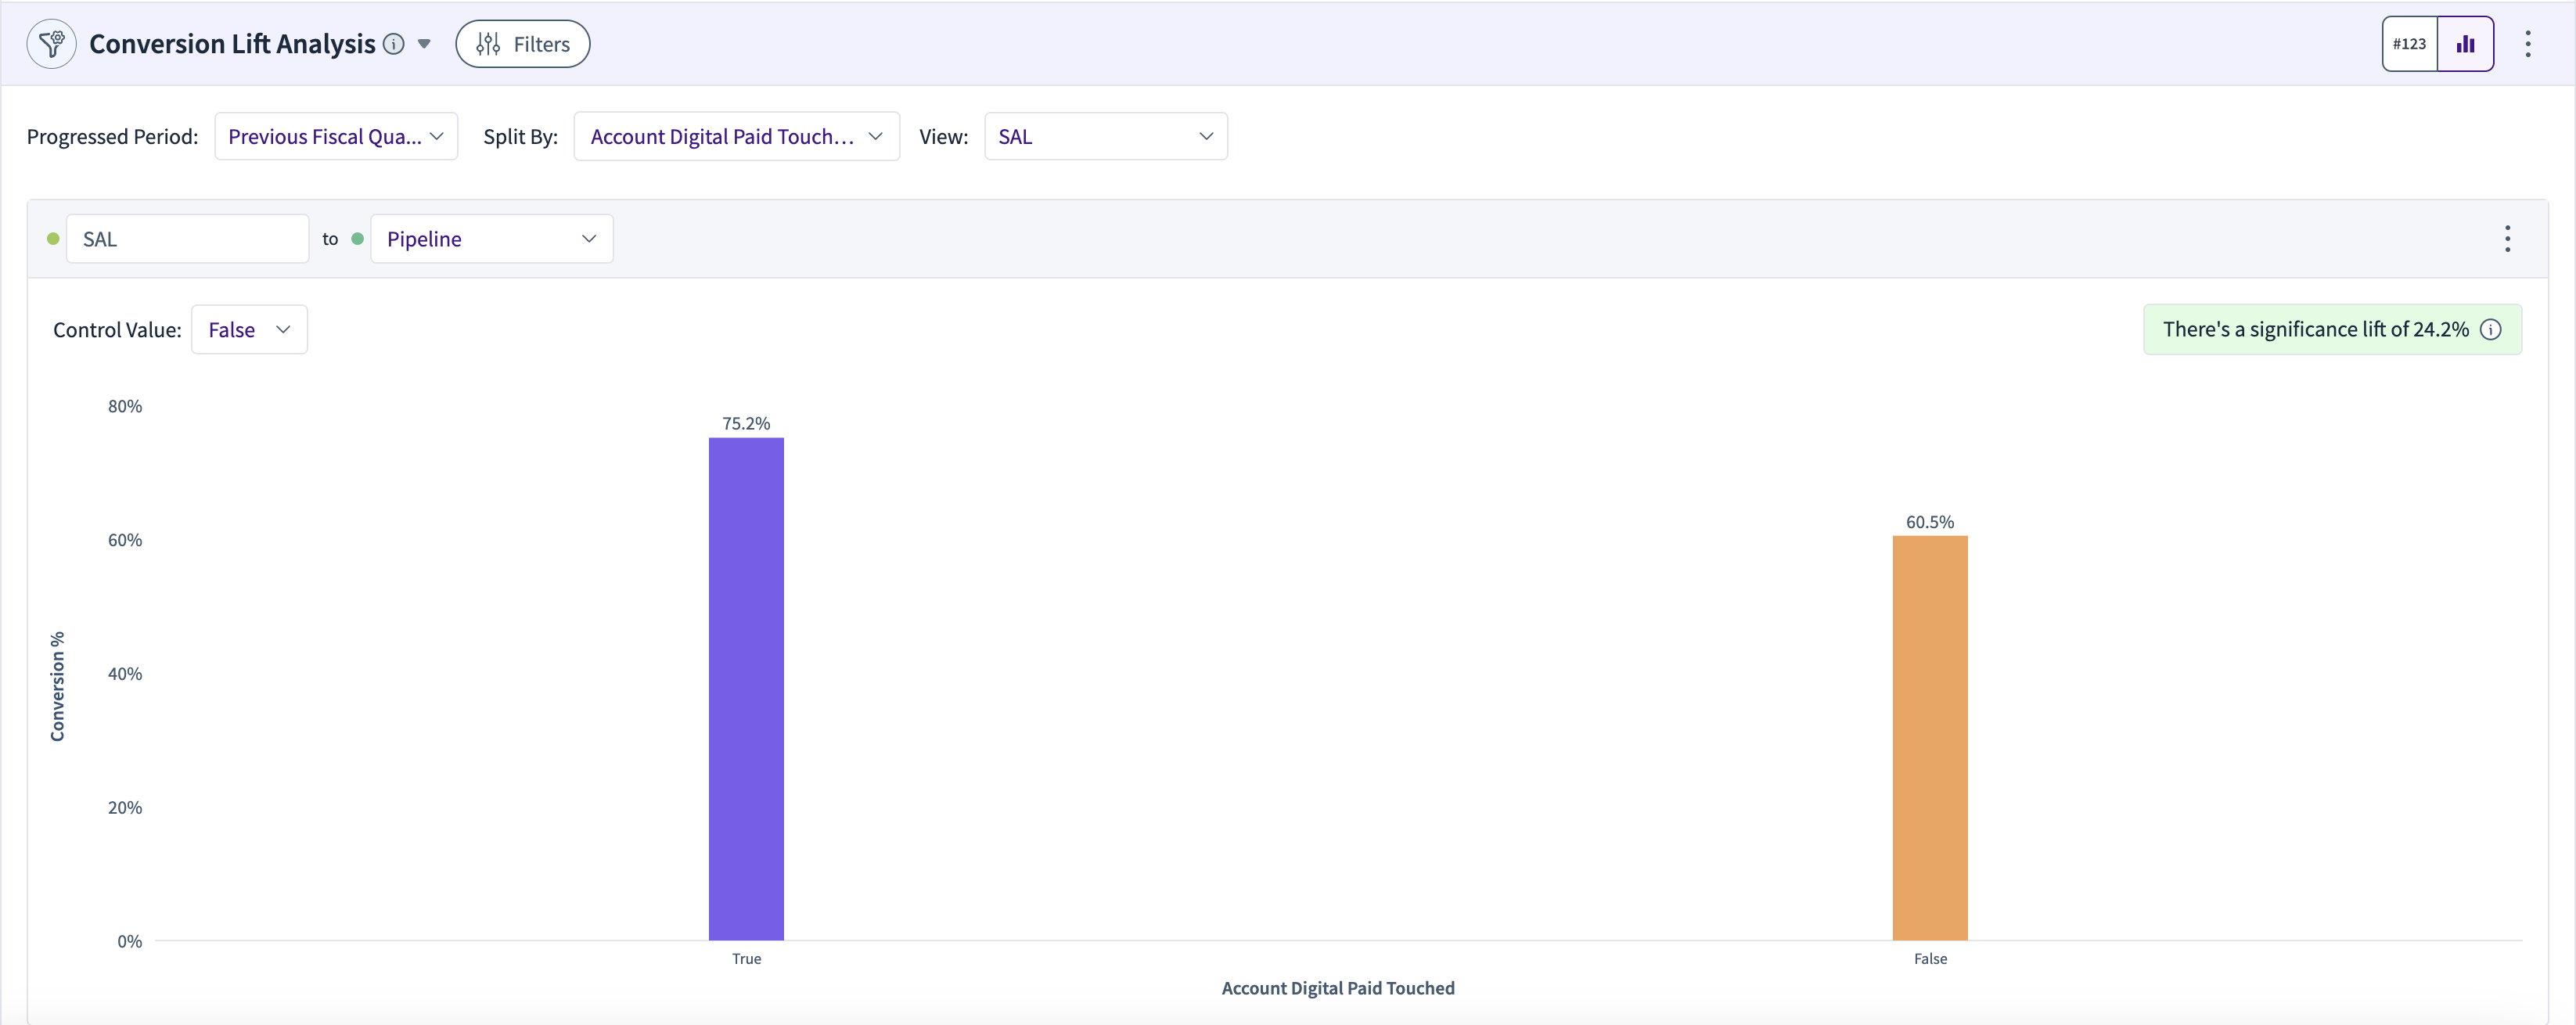
Setting up the Conversion Lift Analysis widget
Select Filters and the (Created) Period as appropriate
Select the Progressed Period for the conversion metric
Select the Split By dimension that defines the Test and Control groups
Select View by Stage for the starting funnel stage of the conversion
Once the above selections are made:
Select the To funnel stage to compute the conversion, and
Select the value from the Split By dimension
Based on these selections, the Conversion Lift Analysis runs dynamically. The widget shows the conversion rate for each value, an estimate of the lift (the difference in conversion between the test and control groups), and whether the lift is statistically significant.
Statistical significance is indicated by the p-value of the test:
If p < 0.05, the lift is statistically significant at the 95% level. You can infer that the marketing/GTM activity had a measurable impact on conversion.
If p ≥ 0.05, the lift is not statistically significant. No inference can be made about whether the activity affected conversion — any observed difference could simply be random variation.
Pre & Post Analysis Widget
The Pre & Post Analysis widget in the Marketing Performance module tests the impact of a marketing/GTM Treatment on a Response Variable.
The Treatment could be a new campaign, an event, a competitor action, an increase in digital spend, etc.
The Response could be an outcome such as pipeline generation, lead generation, or booking value.
The analysis statistically compares the Response Variable before the treatment (pre) with the Response Variable after the treatment (post).
The statistical method used is the two-sample Welch's t-test.
Minimum sample size method: a one-tailed, two-sample t-test–based sample size calculation with finite population correction (FPC). This method also computes Cohen's d, an effect size that indicates how far apart the two samples are given their means and variances.
One-tailed: the test assumes directionality (e.g., post ratio > pre ratio).
Two-sample: the test compares variance from pre-period vs. post-period ratios.
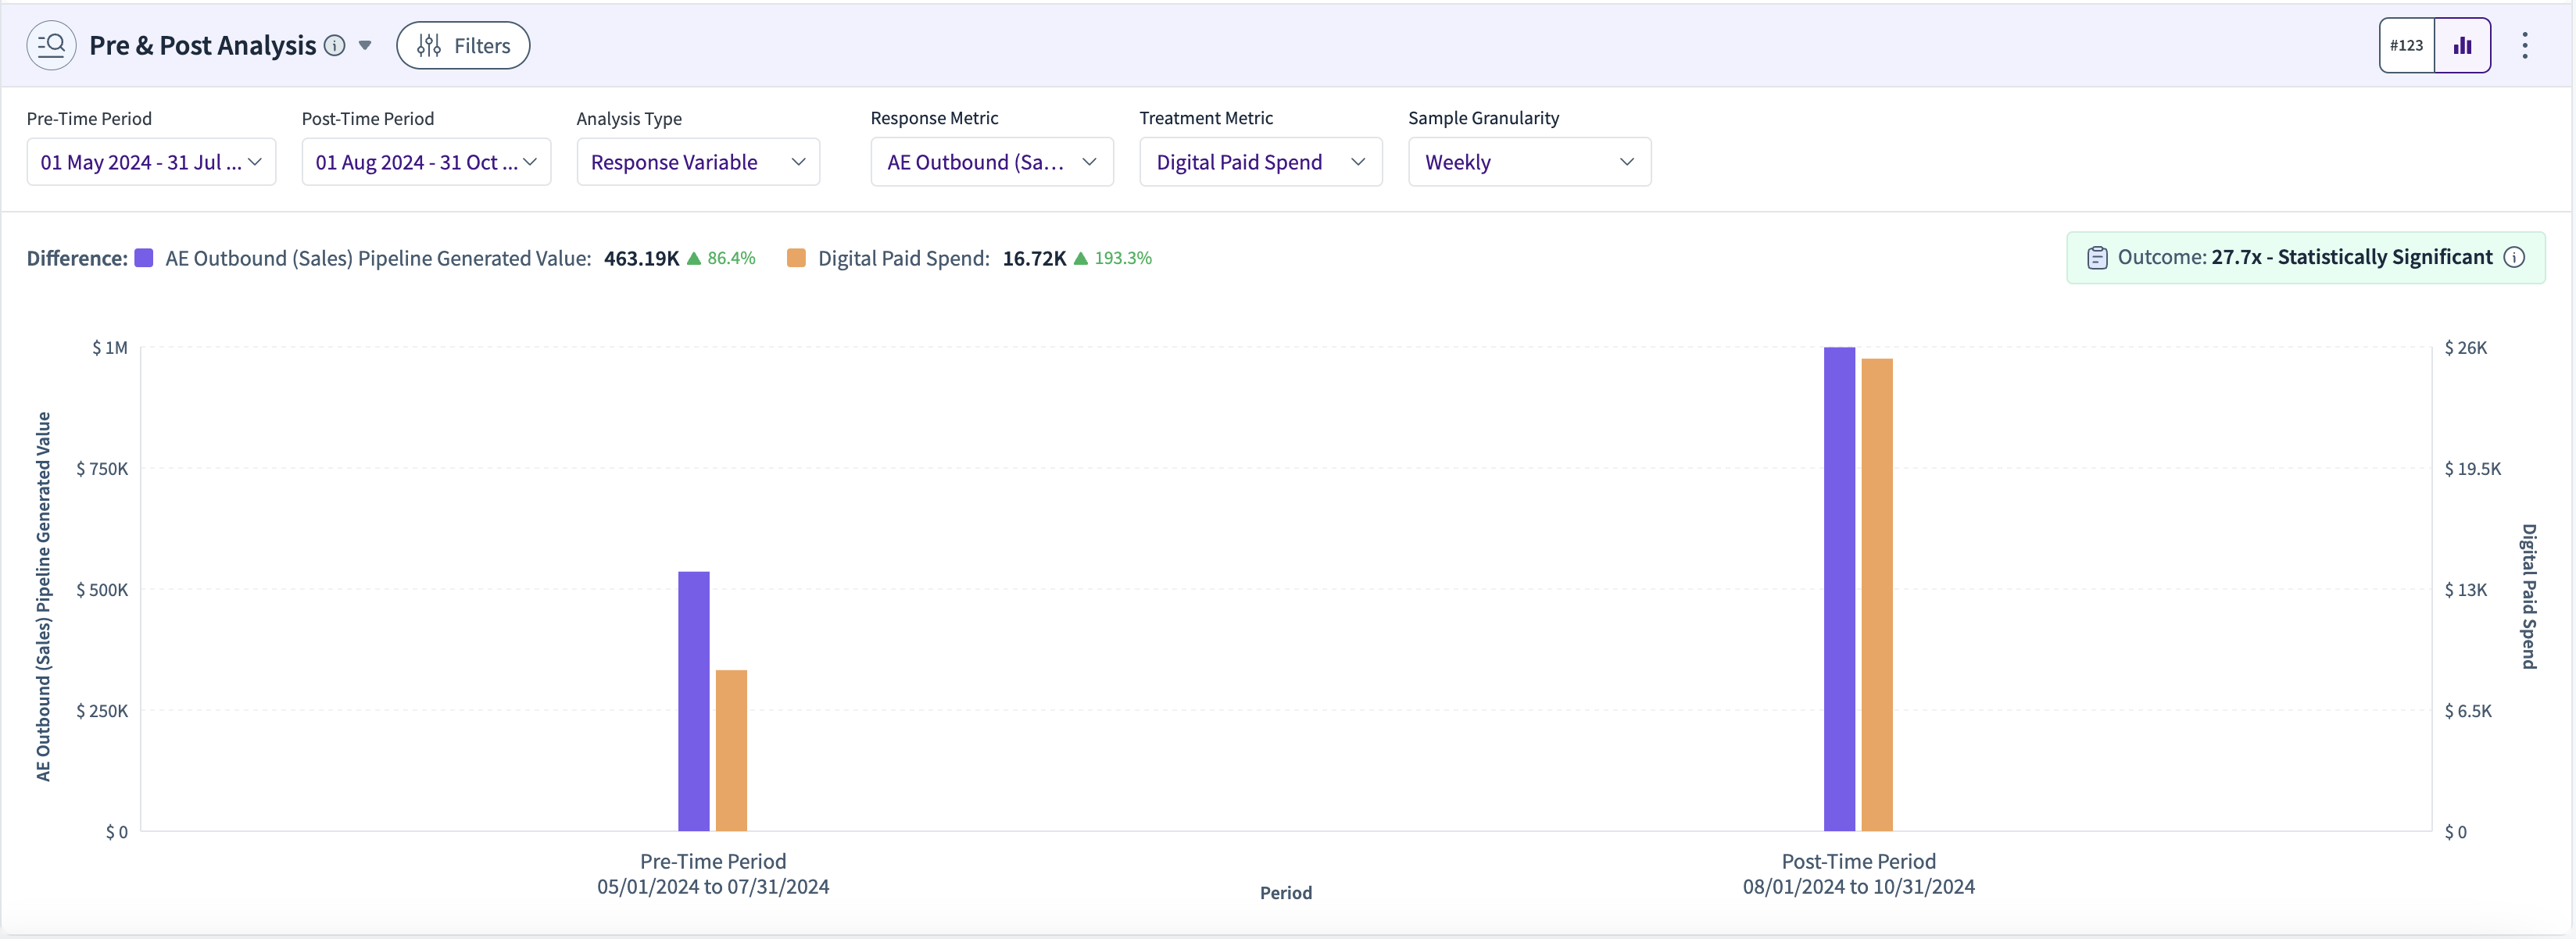
Setting up the Pre-Post Analysis widget
Select Filters, the Date Filter Period, and whether to consider only First Movements
Select the Pre-Time Period (the time period before the treatment)
Select the Post-Time Period (the time period after the treatment)
Select the Treatment metric/variable from the dropdown
Select the Response metric/variable from the dropdown
Select the Test Type:
Response — uses the Response Variable as-is for the pre-post comparison
Ratio — uses the ratio of Response/Treatment for the pre-post comparison
Select the Sample Granularity (Weekly/Monthly/Quarterly) for analyzing the time trend and averages of the Response and Treatment metrics
Output
A chart and table of the averages of the Response and Treatment metrics for the pre and post periods
The average difference in the Response and Treatment metrics between the post and pre periods
The total difference in the Response and Treatment metrics between the post and pre periods
A summary of the outcome: Difference in Response Metric / Difference in Treatment Metric
Statistical significance of the pre-post test, indicated by the p-value:
If p < 0.05, the difference is statistically significant: you can infer that the Treatment had a measurable impact on the Response.
If p ≥ 0.05, the measured difference is not statistically significant: no inference can be made about whether the Treatment affected the Response — any difference observed could simply be random variation.
Difference-in-Differences (Test vs. Control Impact Analysis)
In RevSure, the Difference-in-Differences (DiD) capability extends the Pre & Post Analysis widget to enable causal impact measurement between Test and Control groups. By toggling DiD on, you can evaluate whether a change in a Response Variable is attributable to a Treatment, beyond what would have happened naturally over time.
What Is Difference-in-Differences?
Difference-in-Differences (DiD) is a quasi-experimental technique that compares:
the change over time in an outcome for a Test group, against
the change over time in the same outcome for a Control group.
This allows RevSure to isolate the incremental impact of a marketing or GTM intervention while controlling for baseline trends that affect both groups.
Intuition: if the Test group improves more than the Control group from Pre → Post, the excess improvement can be attributed to the Treatment.
When to Use DiD Analysis
Use DiD when:
You have a clear intervention or treatment (a campaign, a spend increase, an event, etc.)
You can define a Test group that received the treatment
You have a reasonable Control group that did not receive the treatment
Randomized experiments are not feasible, but historical data is available
Key Concepts
Treatment
The action or intervention being evaluated. Examples:
A digital paid spend increase
A new campaign launch
Event execution
Competitor activity
Response Variable
The business outcome impacted by the treatment. Examples:
Pipeline generated
Lead generation
Booking value
Test Group
Entities (leads, opportunities, accounts, etc.) that received the treatment.
Control Group
Entities that did not receive the treatment; they serve as the counterfactual.
How DiD Works in RevSure
1. Enable DiD Analysis
A DiD toggle is available within the Pre & Post Analysis widget
Default state: off
When turned on, a configuration modal opens
DiD Configuration Modal
Step 1: Name the Configuration
Assign a name to the DiD setup for easier reuse and sharing.
Step 2: Define Test and Control Groups
Choose how to configure the Control group using the radio buttons:
(1).png)
Option 1: Default Control Group
The Control group is automatically defined as everyone not included in the Test group
You configure only:
Filters
Date filters
The Consider Only First Movement flag
These apply only to the Test group
Helpful UI cue: a label indicates the size of the Test group.
Option 2: Configure Control Group
You explicitly define both the Test and Control groups
Control group filters must be mutually exclusive of the Test group
While configuring Control filters, you can only select values that do not overlap with the Test selection
Helpful UI cue: a label indicates the size of the Control group.
Additional behavior:
The Treatment metric for the Control group is blank by default
You may optionally define a different Treatment metric at the group level
Validation & Safeguards
Overlapping Test and Control filters trigger a warning
The Run button is disabled for invalid configurations
Missing date filters show inline validation errors
Output & Results
Table View
Results are displayed in a structured table with two collapsible sections:
Test Group
Control Group
.png)
Each section includes:
Metric Type | Pre Period | Post Period |
|---|---|---|
Response | ✓ | ✓ |
Treatment | ✓ | ✓ |
Calculated DiD Metrics
DiD Effect (difference in totals)
DiD Effect (difference in averages)
These quantify the incremental impact attributable to the Treatment.
Statistical Methodology
Estimation Approach
RevSure estimates the DiD effect using Ordinary Least Squares (OLS) regression:
The DiD coefficient captures the incremental impact of the Treatment
It measures how much more (or less) the Test group changed relative to the Control group
Statistical Significance
A two-sided t-test is applied to the DiD coefficient
It uses classical OLS standard errors
It determines whether the observed impact is statistically significant
Interaction with Global Filters
Global filters are disabled when DiD is enabled
This avoids ambiguity and keeps the Test/Control definitions explicit
Summary
Difference-in-Differences in RevSure enables robust, causal measurement of marketing and GTM interventions by extending Pre-Post Analysis to Test vs. Control comparisons. With built-in safeguards, flexible group configuration, and statistically grounded outputs, DiD helps you move from correlation to confident impact attribution.
Multivariate Causal Impact Analysis
This is an advanced version of the Pre-Post Analysis that includes a more rigorous causal-impact methodology, along with the ability to analyze marketing and GTM interventions involving multiple levers, tactics, or campaigns.
The methodology is inspired by Google's CausalImpact approach: https://google.github.io/CausalImpact/CausalImpact.html
It takes two datasets:
Pre-period: before the treatment/campaign/change
Post-period: after the treatment/campaign/change
You provide one response/KPI (the target), a list of covariates (variables not affected by the treatment), and optional treatment fields (kept for reporting).
RevSure fits a time-series model that learns how the KPI normally moves with the covariates. Training only on the pre-period prevents the treatment's effect from leaking into the model.
In the post-period window, the model forecasts what the KPI would have been without the initiative (the counterfactual forecast), including a confidence band that conveys uncertainty.
The impact is then computed: Impact per day/week = Actual − Counterfactual. The widget also shows cumulative lift and % lift.
RevSure reports a Bayesian tail-area probability — the Bayesian equivalent of a p-value — for whether the lift is greater than zero:
If p < 0.05, the impact/lift is considered statistically significant.
If p ≥ 0.05, the lift/impact is not statistically significant: no inference can be made about whether the marketing/GTM activity drove the lift — any difference observed could simply be random variation.
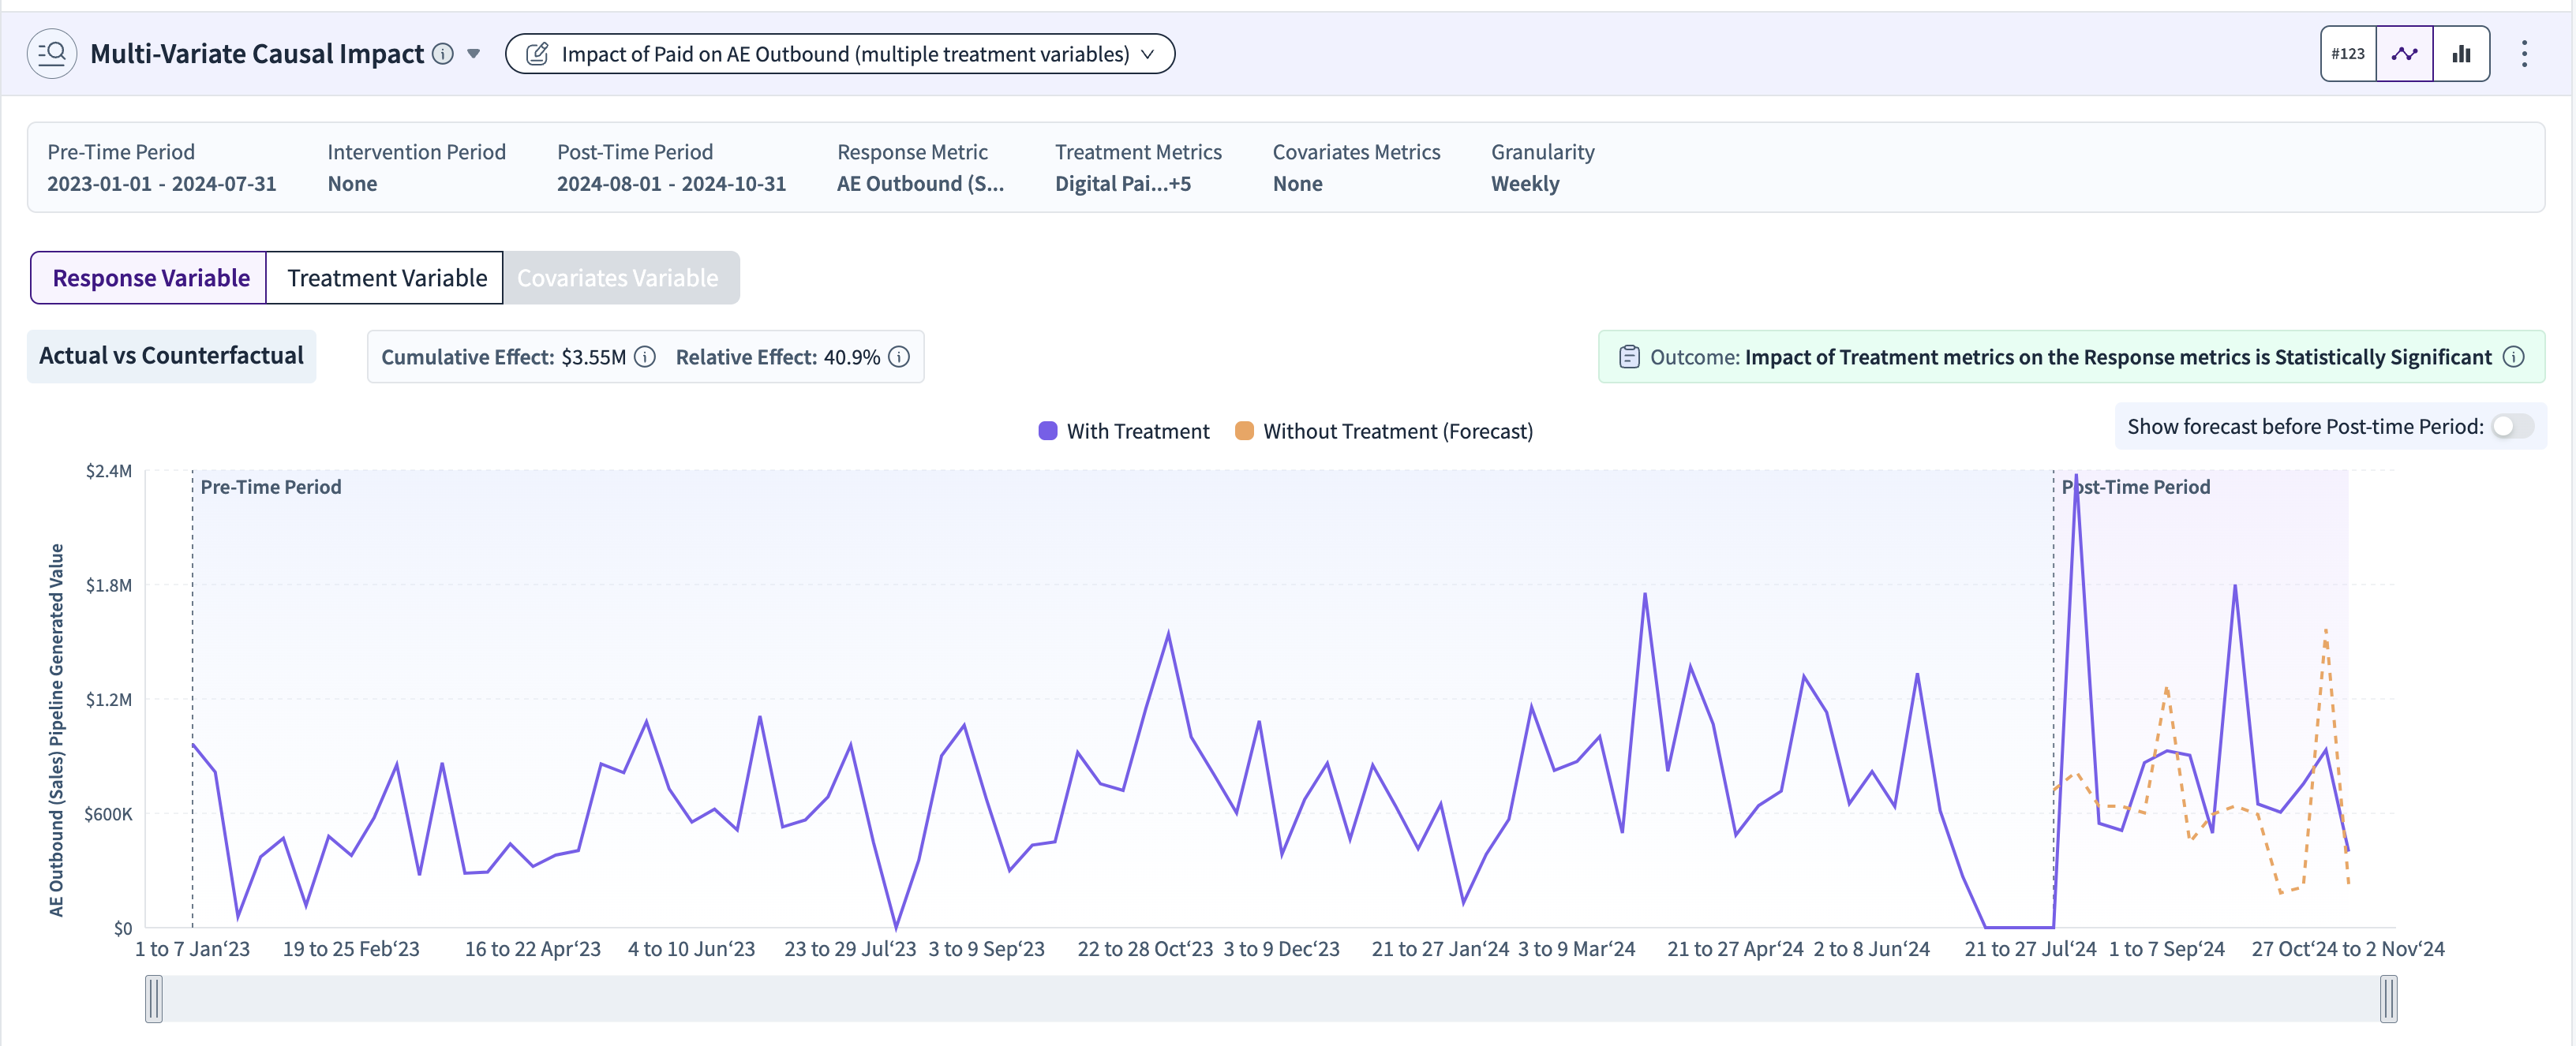
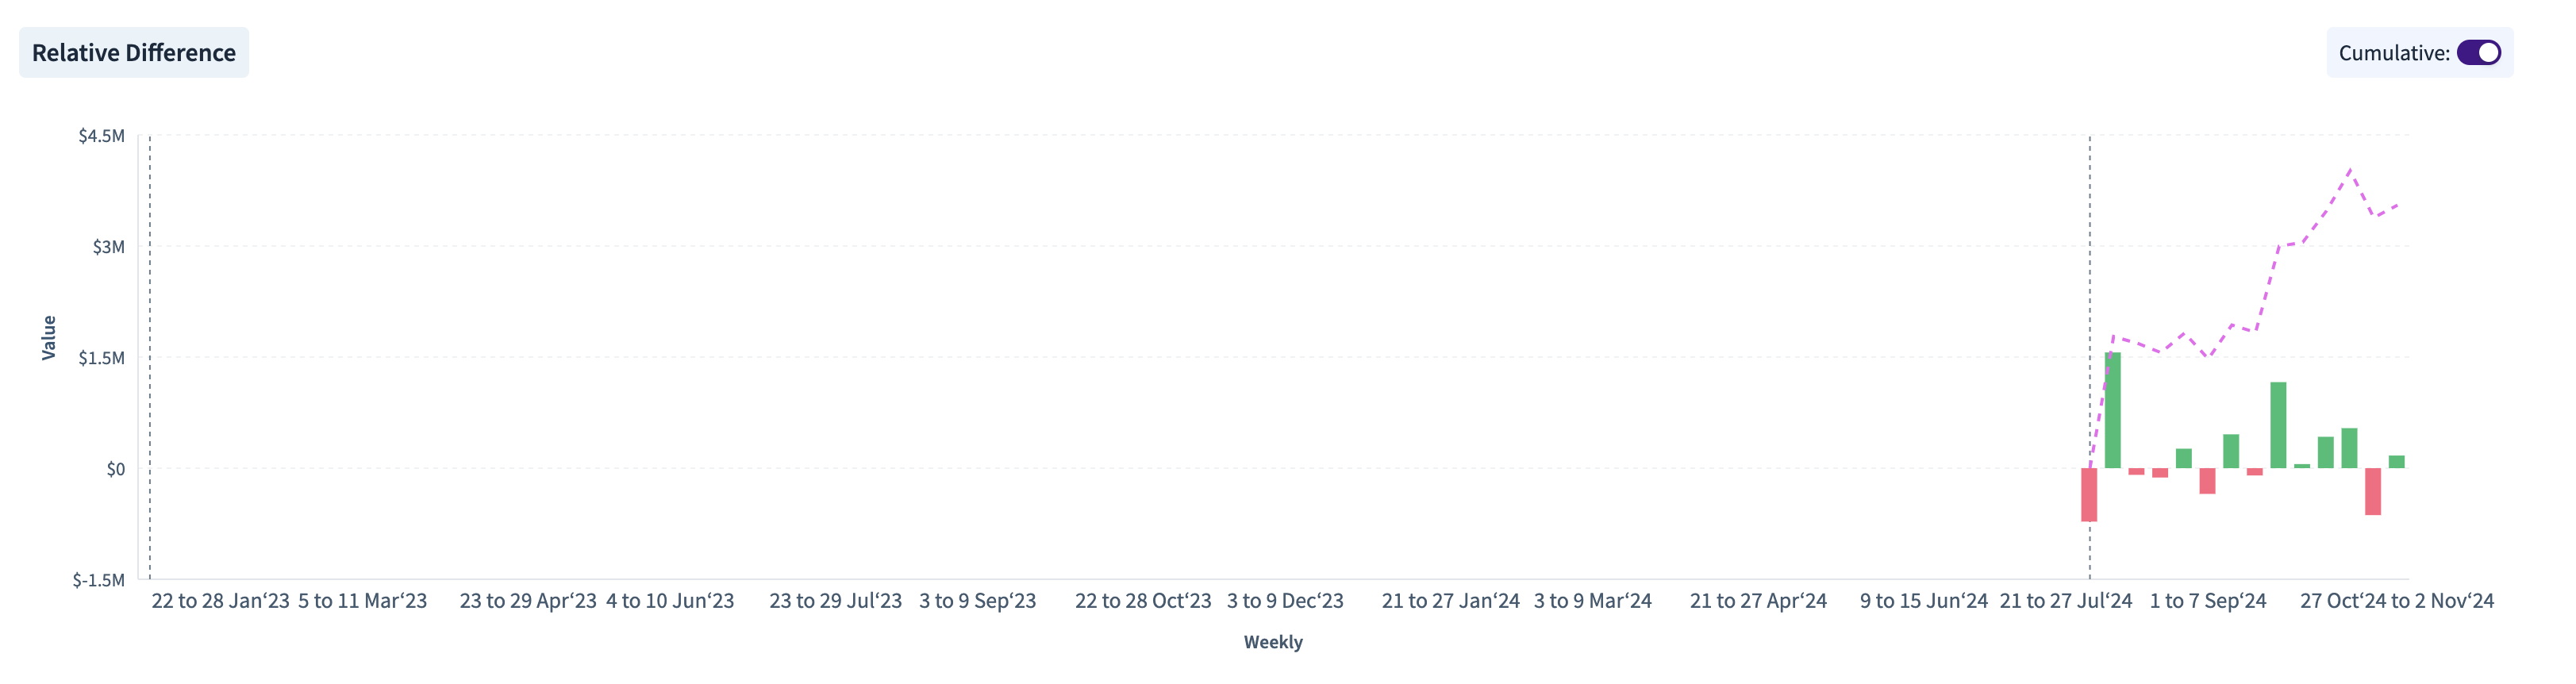
Setting up the Multivariate Causal Impact Analysis widget
Select Filters, the Date Filter Period, and whether to consider only First Movements
Edit the Configuration
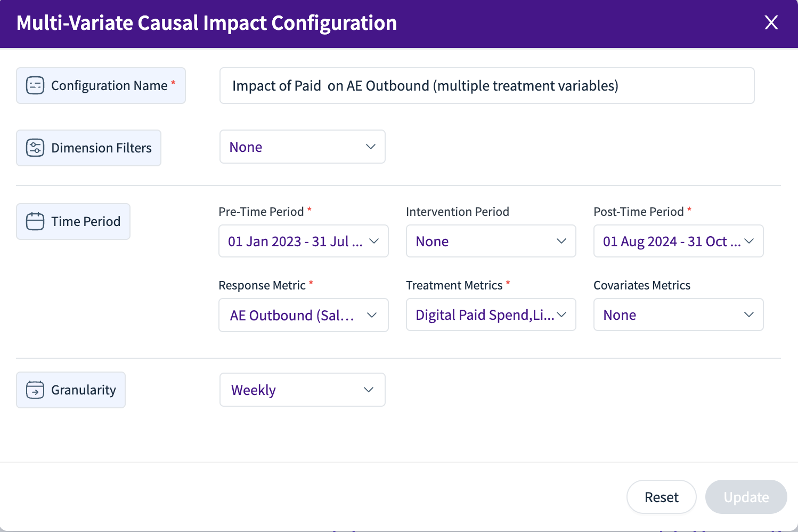
The widget supports running multiple configurations of the Causal Impact Analysis
Use configurations to test different interventions, response variables, and periods
Each configuration includes:
The Pre-Time Period (before the treatment)
The Intervention Time Period (during the intervention)
The Post-Time Period (after the intervention)
Treatment metrics/variables — the marketing/GTM interventions made in the hope of driving a particular Response outcome
The Response metric/variable
Covariate metrics/variables — metrics that are not part of the intervention but influence the response (e.g., macroeconomic conditions, seasonality)
Sample Granularity (Weekly/Monthly/Quarterly) for analyzing the time trend and averages of the Response and Treatment metrics
A configuration can take a few minutes to run
Output
Once the configuration runs, the test results appear on the widget across three tabs:
Response Variable tab (image above)
Trend chart — shows the trend of the Response Variable across the Pre, Intervention, and Post periods. In the Post-period region, the dotted line shows the expected Response (the without-treatment forecast) had no intervention been made.
Key test metrics are summarized:
Cumulative Effect: the sum of the differences between the actual Response (with treatment) and the expected Response (without-treatment forecast) during the Post period.
% Relative Effect: the Cumulative Effect divided by the sum of the expected Response (without-treatment forecast) during the Post period.
Together, the Cumulative Effect and Relative Effect % summarize the magnitude of the outcome.
The test also summarizes the statistical significance of the impact.
Relative Difference chart — shows the difference between the actual Response (with treatment) and the expected Response (without-treatment forecast) for each time bucket during the Post period, indicated by red and green bars. The dotted line shows the rolling cumulative effect for each bucket.
Treatment tab
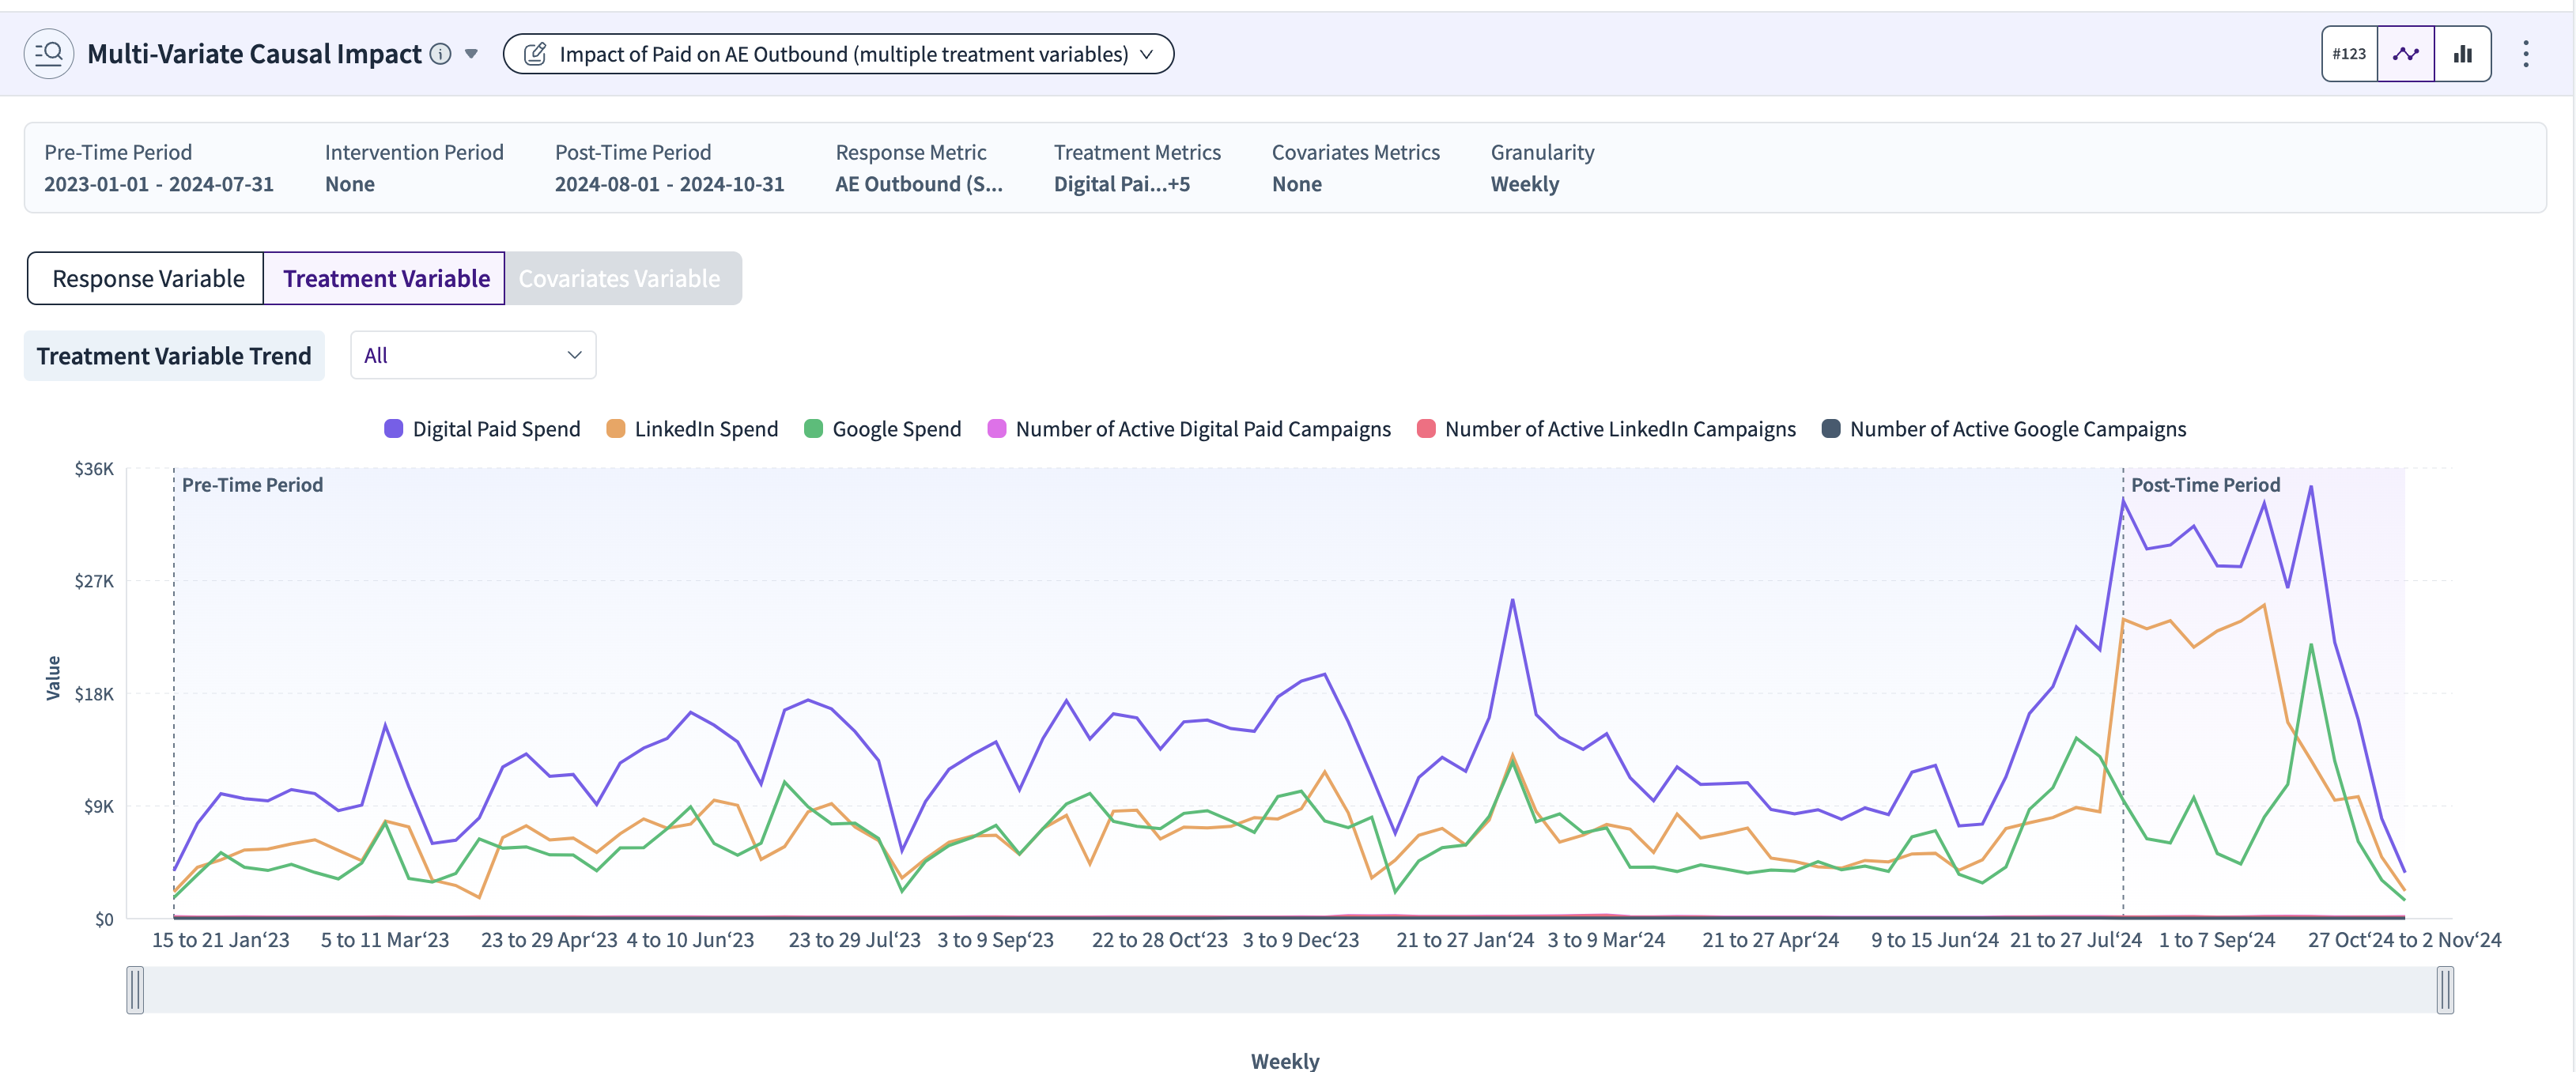
Shows trend charts of the treatment variables across the Pre, Intervention, and Post periods.
Covariates tab
Shows trend charts of the covariate variables across the Pre, Intervention, and Post periods.
Campaign Lift Analysis — Across Campaigns
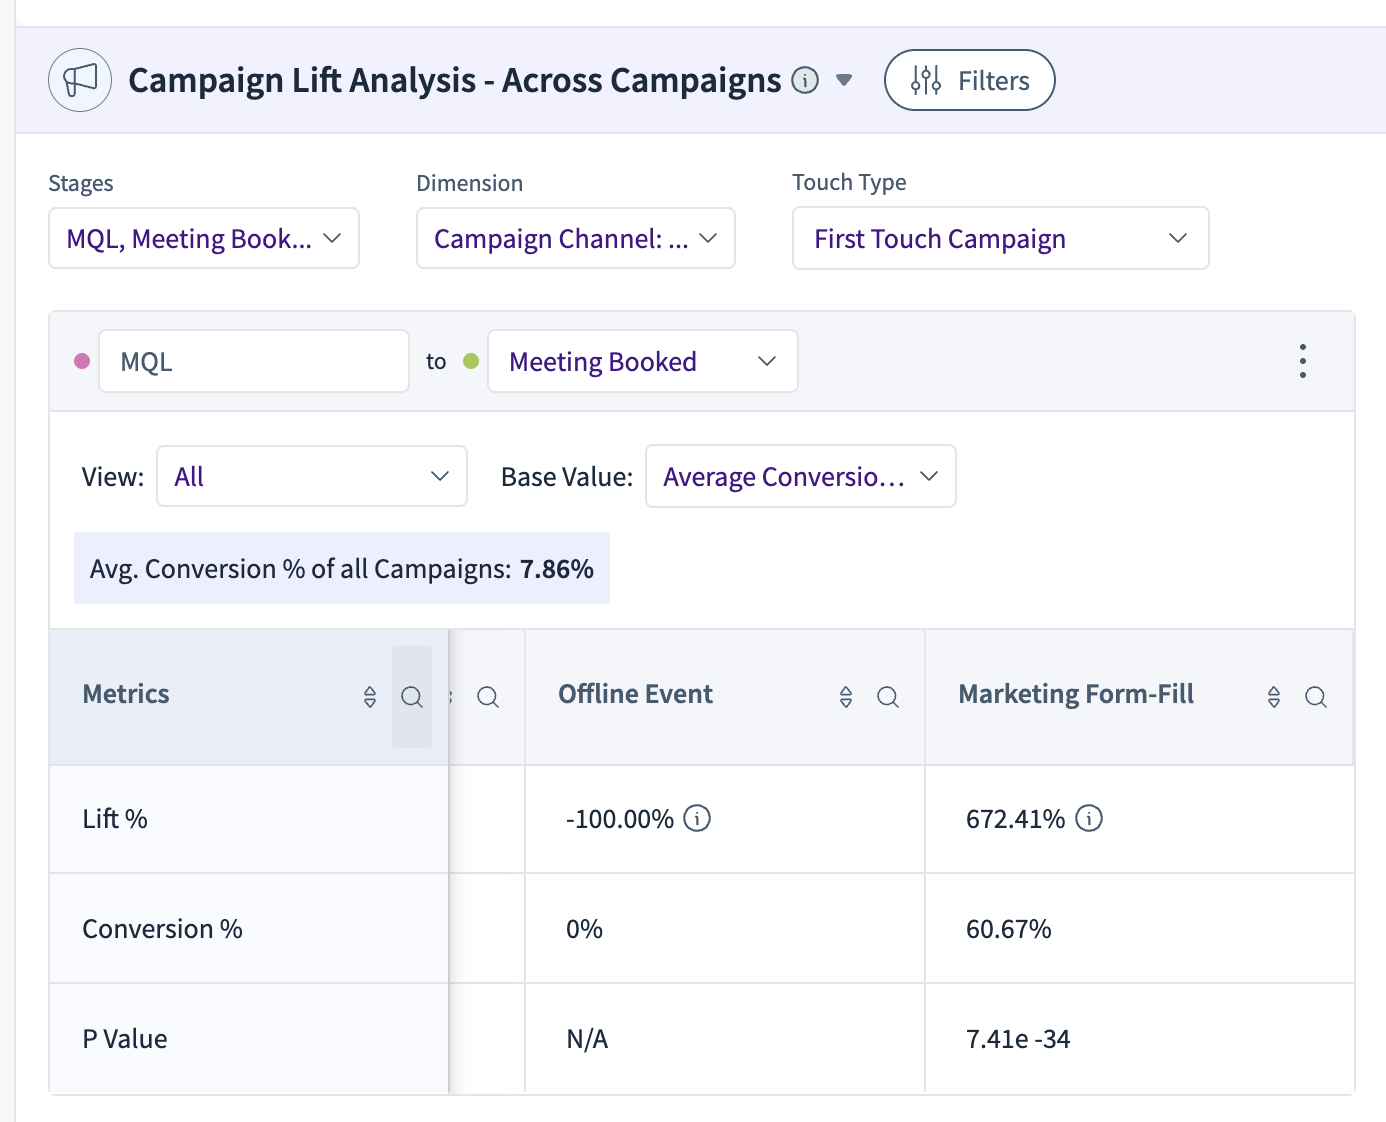
The Campaign Lift Analysis widget measures the impact of specific campaigns, campaign types, or channels on conversion rates across your funnel. It uses statistical significance to determine whether a campaign meaningfully contributes to conversion from one stage to another.
This analysis compares the conversion lift of a selected campaign against others using a chi-squared test. It answers:
Does a touch from this campaign/channel/type improve conversion likelihood?
Is the improvement statistically significant?
Where in the funnel is the lift most visible?
Minimum sample size method: a power calculation based on the two-proportion z-test.
Set your filters:
Created & Progressed Periods: select the time range (e.g., previous 365 days).
Stages: choose the stage pair (e.g., Lead → MQL or MQL → Pipeline).
Touch Type: select First Touch, Last Touch, or Any Touch.
Dimension: pick the level of comparison — Campaign Type, Campaign Channel, Campaign Name, etc.
Top 5: the top 5 values of the selected dimension, ranked by highest conversion percentage.
Contacts Considered: for lead-to-opportunity stage conversion, which contacts to count:
All Contacts in Account
All Contacts in Opportunity
Primary Contact in Opportunity
Base Value: choose whether lift is measured against:
the average of all campaigns
the average of selected campaigns
a specific campaign

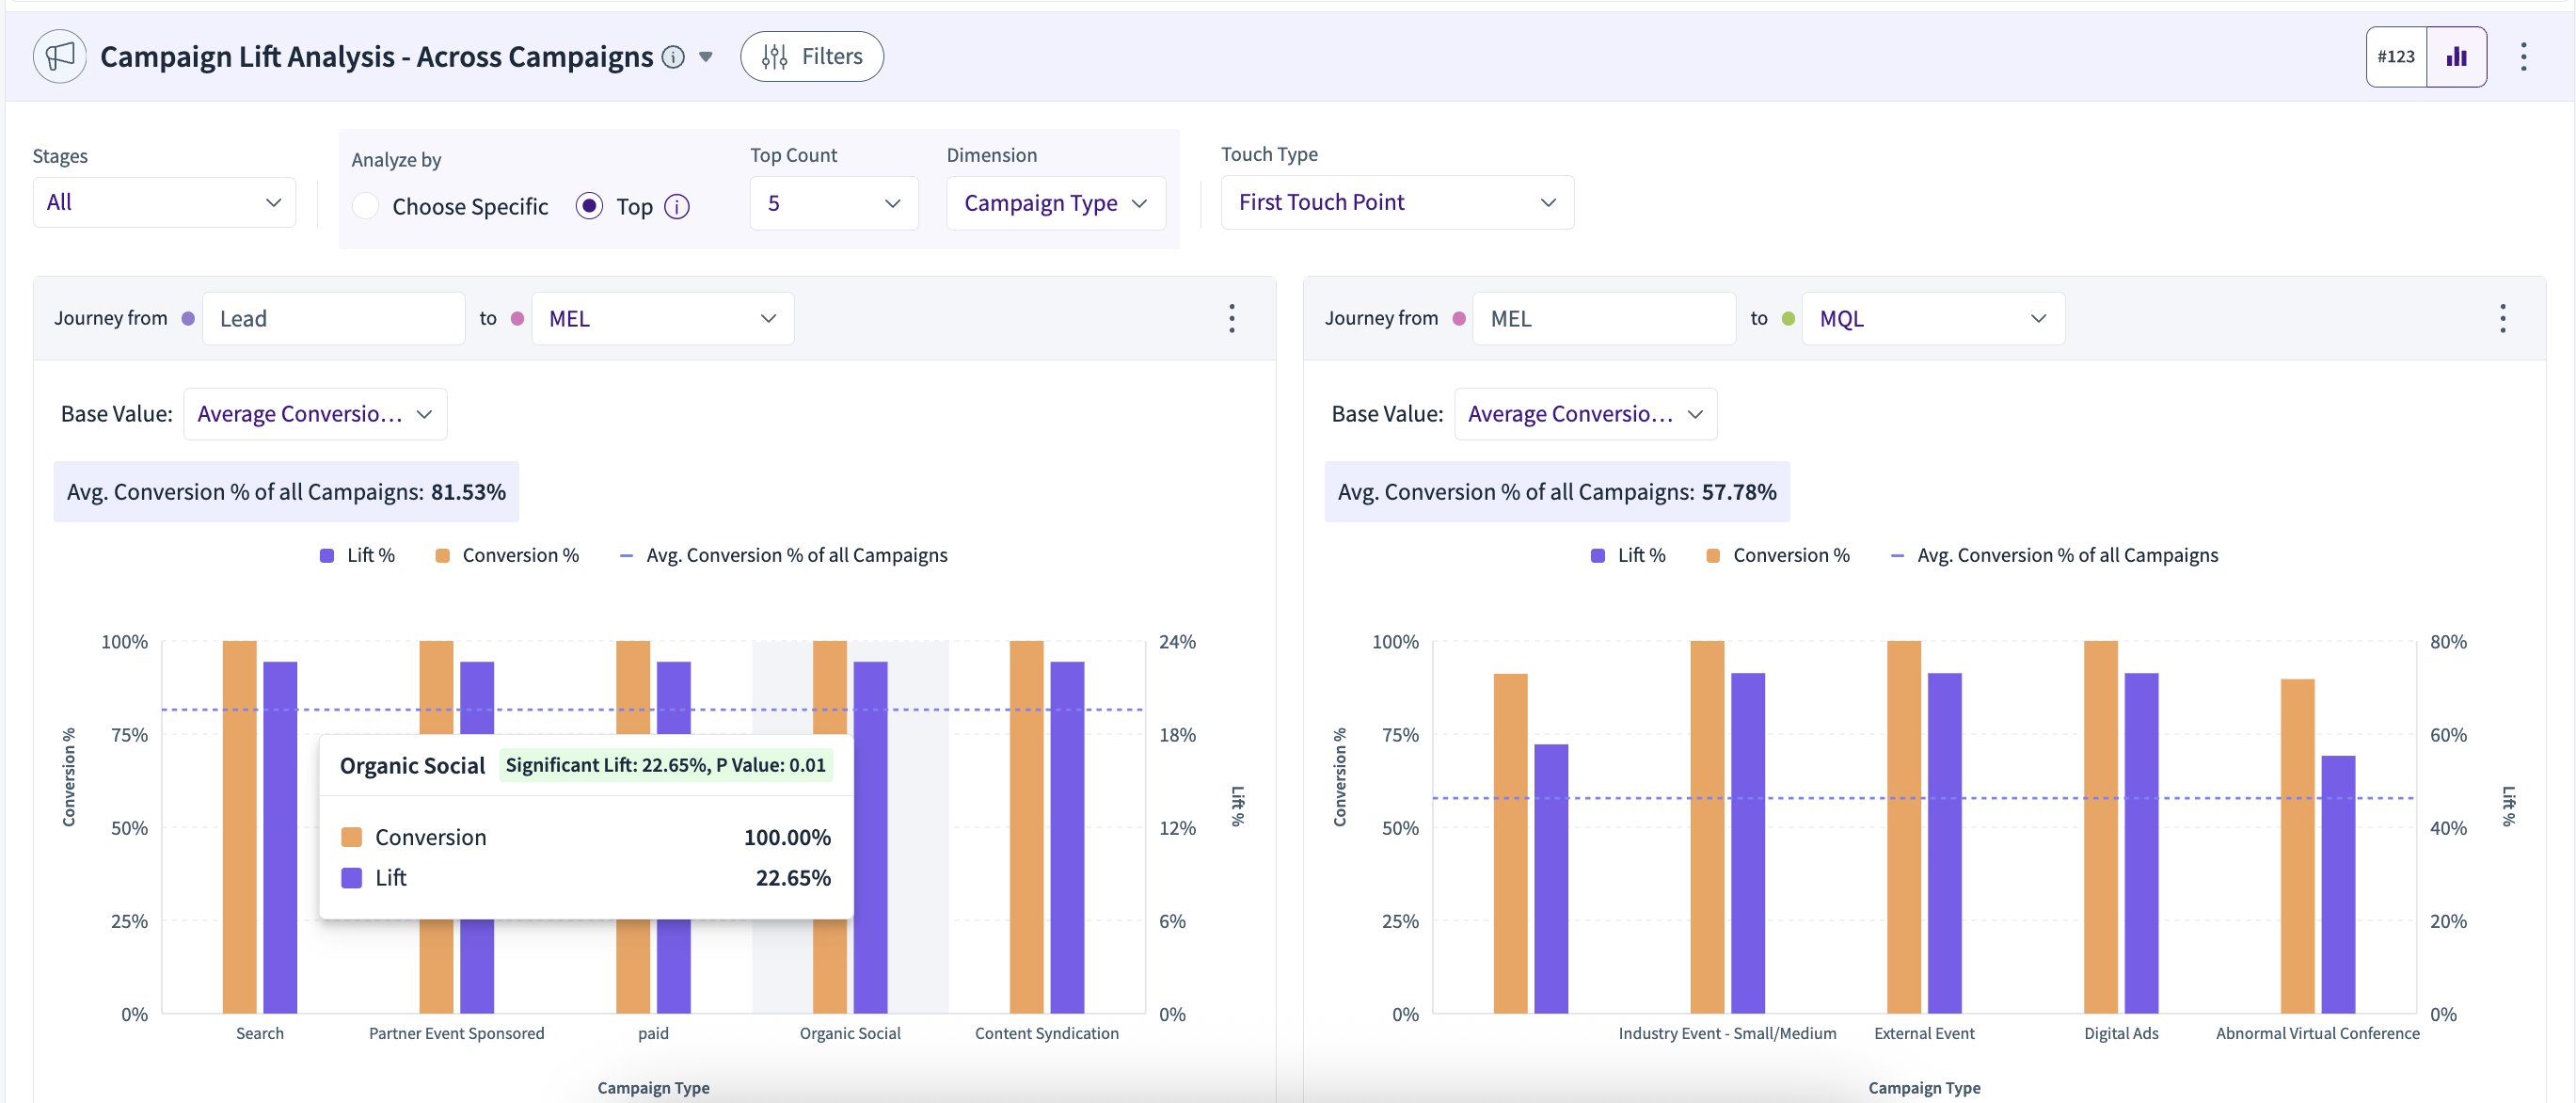
Understand the output:
Conversion %: the percentage of leads/accounts with a touch from that campaign/channel/type in the journey from the start stage to the end stage that converted to the end stage.
Lift %: how much higher (or lower) the conversion % is compared to the base.
Statistical significance: a campaign/channel shows Significant Lift when p < 0.05.
Example: Organic Social shows a +22.65% lift (p < 0.05) — leads whose first touch was Organic Social converted from Lead to MQL at 100%, versus 81.53% across all other campaigns.
[EDITOR NOTE: Consider replacing this example with one where the test group converts below 100% — a 100% conversion rate typically signals a very small sample and undercuts the credibility of the example. Also confirm whether the accompanying screenshot shows a tenant-specific stage name (e.g., MEL); if so, either regenerate the screenshot or add a note that stage names are tenant-configurable.]
Campaign Lift Analysis — Individual Campaigns
The Campaign Lift Analysis — Individual Campaigns widget uses the same methodology as the Across Campaigns widget. The difference is how the lift is calculated:
Individual Campaigns compares lift within the same campaign: whether having a touch from the campaign is more beneficial than not having it. For example, with first touch selected, it analyzes whether an MQL whose first touch was Marketing Form-Fill has a higher chance of converting than an MQL whose first touch was not Marketing Form-Fill.
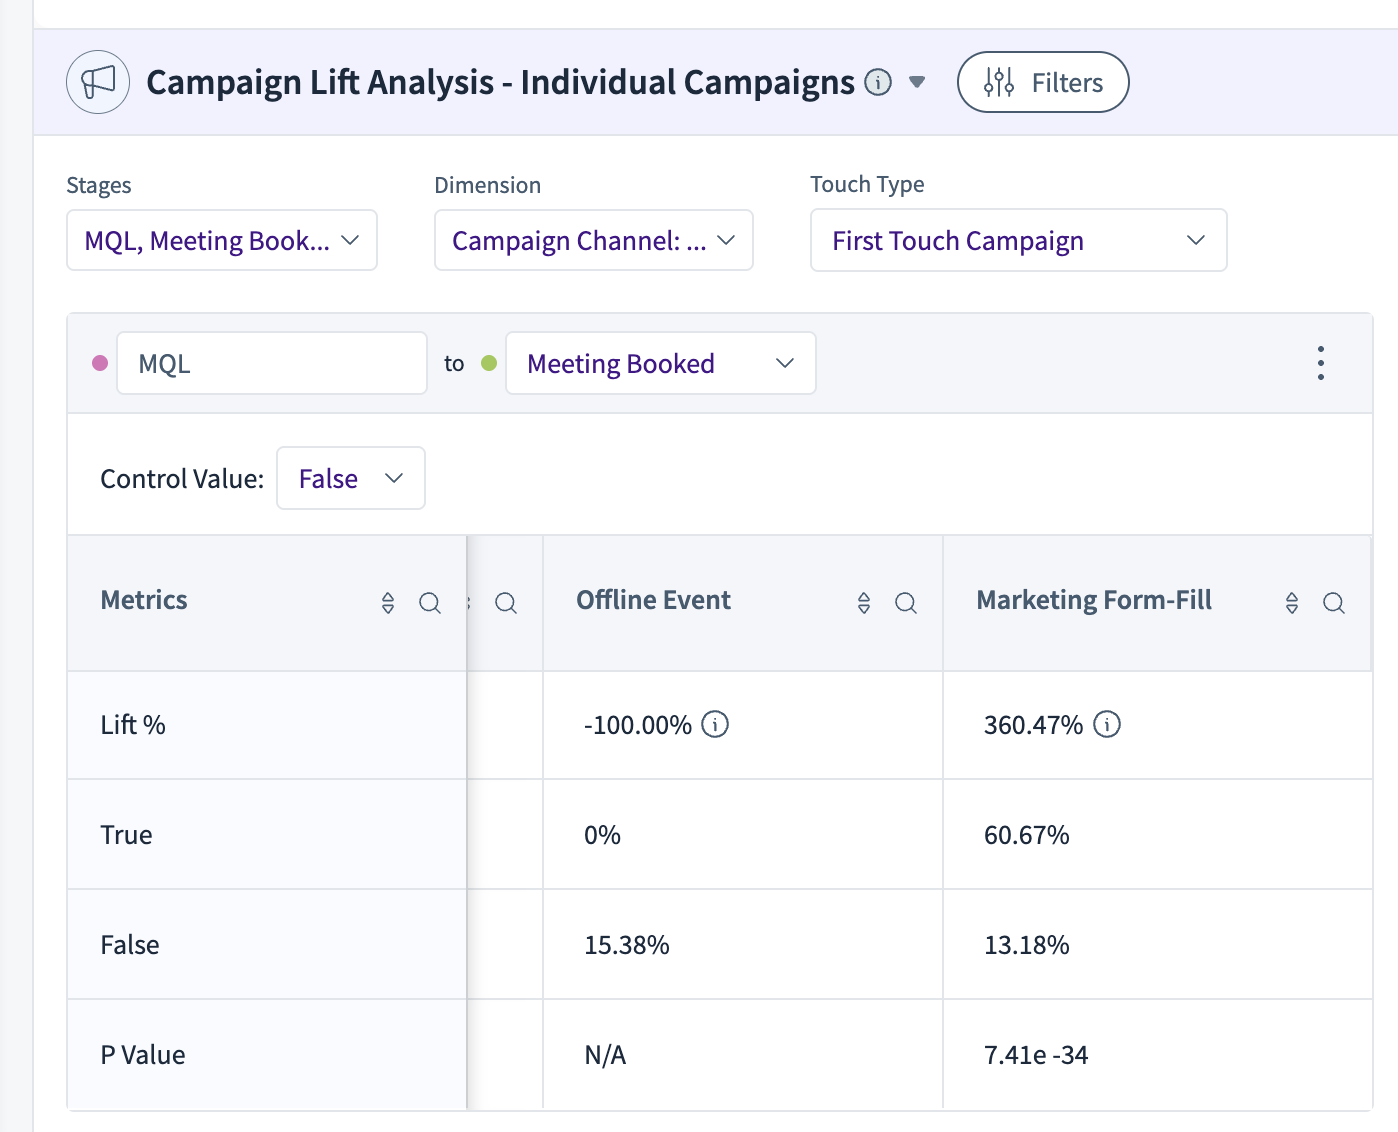
Across Campaigns compares lift against other campaigns: whether a touch from the campaign is more beneficial than a touch from any other campaign. For example, with first touch selected, it analyzes whether leads whose first touch was Marketing Form-Fill convert at a higher rate than leads first touched by any other campaign.
Note: the Conversion % in Across Campaigns equals the True value in Individual Campaigns.
Control Value — specifies which group the lift is computed against. Because you typically want the lift of True (touched) over False (not touched), the Control Value is usually False and the Test Value True.
Minimum sample size method: a power calculation based on the two-proportion z-test.
Calculation Logic for Campaign Lift Analysis
Individual Campaigns
Calculating the conversion % of a campaign touch:
Number of leads with a campaign touch that converted — X
Number of leads with a campaign touch that did not convert — Y
Number of leads without a campaign touch that converted — X′
Number of leads without a campaign touch that did not convert — Y′
Conversion % of True = X / (X + Y)
Conversion % of False = X′ / (X′ + Y′)
Calculating the lift:
If the Control Value is False: (Conversion of True − Conversion of False) / Conversion of False
If the Control Value is True: (Conversion of False − Conversion of True) / Conversion of True
Across Campaigns
Conversion % of a campaign:
Number of leads with a touch from the campaign that converted — X
Number of leads with a touch from the campaign that did not convert — Y
Conversion % of the campaign = X / (X + Y)
Conversion % of all campaigns:
Number of leads touched by any campaign that converted — X
Number of leads touched by any campaign that did not convert — Y
Conversion % = X / (X + Y)
Conversion % of selected campaigns:
Number of leads touched by any of the selected campaigns that converted — X
Number of leads touched by any of the selected campaigns that did not convert — Y
Conversion % = X / (X + Y)
Lift:
Against the average of all campaigns: (Conversion of the campaign − Conversion of all other campaigns) / Conversion of all other campaigns
Against the average of selected campaigns: (Conversion of the campaign − Conversion of the selected other campaigns) / Conversion of the selected other campaigns
Against a specific base campaign: (Conversion of the campaign − Conversion of the base campaign) / Conversion of the base campaign